. 2020 Oct 13;117(41):25667-25678.
doi: 10.1073/pnas.2008571117. Epub 2020 Sep 25.

Delineation of a molecularly distinct terminally differentiated memory CD8 T cell population

Affiliations

Delineation of a molecularly distinct terminally differentiated memory CD8 T cell population

J Justin Milner et al. Proc Natl Acad Sci U S A. .

Abstract

Memory CD8 T cells provide durable protection against diverse intracellular pathogens and can be broadly segregated into distinct circulating and tissue-resident populations. Paradigmatic studies have demonstrated that circulating memory cells can be further divided into effector memory (Tem) and central memory (Tcm) populations based on discrete functional characteristics. Following resolution of infection, we identified a persisting antigen-specific CD8 T cell population that was terminally fated with potent effector function but maintained memory T cell qualities and conferred robust protection against reinfection. Notably, this terminally differentiated effector memory CD8 T cell population (terminal-Tem) was conflated within the conventional Tem population, prompting redefinition of the classical characteristics of Tem cells. Murine terminal-Tem were transcriptionally, functionally, and developmentally unique compared to Tem cells. Through mass cytometry and single-cell RNA sequencing (RNA-seq) analyses of human peripheral blood from healthy individuals, we also identified an analogous terminal-Tem population of CD8 T cells that was transcriptionally distinct from Tem and Tcm Key findings from this study show that parsing of terminal-Tem from conventionally defined Tem challenge the reported characteristics of Tem biology, including enhanced presence in lymphoid tissues, robust IL-2 production, and recall potential, greater than expected homeostatic fitness, refined transcription factor dependencies, and a distinct molecular phenotype. Classification of terminal-Tem and clarification of Tem biology hold broad implications for understanding the molecular regulation of memory cell states and harnessing immunological memory to improve immunotherapies.

Keywords: T cells; immunology; infection; memory T cells.


Conflict of interest statement

Competing interest statement: A.W.G. serves on the scientific advisory boards of Pandion Therapeutics and Arsenal Bio.

Figures

Fig. 1.
Fig. 1.
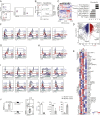
Terminal-Tem are a distinct subset of CD8 T cells contained within the conventional Tem population. P14 CD8 T cells were adoptively transferred into congenically distinct recipient mice that were subsequently infected with LCMV. (A) Expression of KLRG1, CD127 (Left), and CD27 (Right) by Tcm (CD62Lhi) and conventional (Conv.) Tem (CD62Llo) within peripheral blood lymphocytes (PBLs) on day 70 of infection. (B) Expression of indicated molecules on P14 PBLs in response to LCMV infection. Frequency of CD127loCD62Llo (highlighted red), CD127hiCD62Llo (highlighted gray), and CD127hiCD62Lhi (highlighted blue) in PBLs following LCMV infection (Bottom). (C) Representative expression patterns of indicated molecules by terminal-Tem, Tem, Conv. Tem, and Tcm. (D) Representative flow cytometry plots demonstrating the frequency of terminal-Tem, Tem, and Tcm in indicated tissues (>30 d postinfection). Splenic red and white pulp localized P14 cells were discriminated by intravascular staining of CD8α. (E) Principal component analysis of the RNA-seq transcriptional profile of splenic terminal-Tem, Tem, Conv. Tem, and Tcm P14 cells on day 55 of infection (Left), and heatmap illustrating differentially expressed genes (≥1.5-fold) ordered through k-means clustering (Top Right) among terminal-Tem, Tem, Conv. Tem, and Tcm, or highlighted key genes (Bottom). Numbers in plots are the frequency of cells in the indicated gate (AD). All data are from two independent experiments with n = 3 to 5 per timepoint, and RNA-seq samples consist of two biological replicates wherein each replicate is comprised of cells pooled from two mice. Graphs indicate mean ± SEM, and symbols represent an individual mouse (B).
Fig. 2.
Fig. 2.
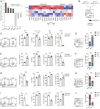
Distinct fate, homeostasis, and effector phenotype of CD127loCD62Llo terminal-Tem and CD127hiCD62Llo Tem. (A) More than 30 d after LCMV infection, terminal-Tem (CD127loCD62Llo), Tem (CD127hiCD62Llo), and Tcm (CD127hiCD62Lhi) P14 memory subsets were sorted and transferred into naive, congenically distinct mice. After >30 d posttransfer, the frequency of each donor population in the spleen was analyzed by flow cytometry. Representative plots (Top) and quantification of the phenotype (Bottom) are shown as well as frequency of donor cells recovered from lymph nodes (Bottom Right). (B) Three-way comparisons of differentially expressed genes (≥1.5-fold) within the indicated gene-expression signature were plotted in a hexagonal diagram in which the magnitude of differential expression is reflected by distance from the origin. Rose plots (Upper Right corner of each hexagonal plot) indicate the percentages of genes in each orientation. Memory- (Top), effector- (Middle), and proliferation-associated (Bottom) genesets are displayed. (C) Flow cytometry analysis of terminal-Tem, Tem, Conv. Tem, and Tcm on day >D35 of infection. Representative plots (Left) and quantification of geometric mean fluorescence intensity (gMFI) or % positive (Right) are shown. (D) Memory subsets were sorted and cultured ex vivo with GP33–41 peptide and congenically distinct splenocytes for assessment of TNFα, IFNγ, IL-2 production, and degranulation (CD107a). Representative flow cytometry plots (Top) and quantification of the frequency of cytokine production by each subset (Bottom) are shown. (E) GzA and GzB expression by terminal-Tem, Tem, and Tcm was analyzed by flow cytometry (Left) and quantified (Right). (F) OT-I CD8 T cells were transferred into congenically distinct mice that were infected with LM-OVA the following day. More than 30 d after infection, terminal-Tem (CD127loCD62Llo), Tem (CD127hiCD62Llo), and Tcm (CD127hiCD62Lhi) subsets were sorted and transferred to naive recipients that were challenged with LM-OVA. On day 3 of challenge, bacterial load in spleens was assessed (CFU/gram of tissue) and abundance of donor cells in recipient spleens were enumerated by flow cytometry. Numbers in plots represent gMFI or the frequency of cells in the indicated gate (A, C, and E). All data are from one representative experiment of three independent experiments with n = 3 to 4 per group (A and C), or data are combined from three independent experiments (Ki-67 staining in C and F), or data are combined from two independent experiments (E), or combined from three independent experiments where each experiment consisted of two biological replicates and each replicate was sorted from one or two mice combined (D); n.s., not significant, *P < 0.05, ***P < 0.005. Graphs indicate mean ± SEM, and symbols represent an individual mouse or an individual replicate.
Fig. 3.
Fig. 3.
Terminal-Tem are memory T cells with features of terminal effector CD8 T cells. Memory cells were generated as in Fig. 1. (A) Flow cytometric analyses of splenic P14 CD8 T cells on days 7 or 50 of infection. (B) Principal component analysis of RNA-seq data. (C) GSVA of HALLMARK genesets, wherein rows and columns are ordered by hierarchical clustering (Left) with key molecular processes unique to terminal-Tem compared with all other populations highlighted (Right). Heatmap populations are denoted by color as in B. (D) Volcano plot illustrating differentially expressed genes. (E) Heatmap of select genes. (FI) Representative expression of key molecules on day 7 (TE/MP) or 55 post-LCMV infection. (J) KLRG1hi or KLRG1lo P14 CD8 T cells were sorted from spleens on day 7 of LCMV infection and transferred into infection-matched, congenically distinct mice (Left). Representative phenotype of donor cells and quantification of frequency of each memory population (Right) >30 d after transfer. Numbers in plots represent the frequency of cells in the indicated gate or gMFI (FJ). All data are from one representative experiment out of three independent experiments (A) or two independent experiments (FJ) with n = 3 to 4 per group; *P < 0.05, ***P < 0.005. Graphs indicate mean ± SEM, symbols represent an individual mouse (J).
Fig. 4.
Fig. 4.
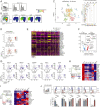
Terminal-Tem and Tem exhibit differential dependencies on key lineage-specifying transcription factors. (A) Regulatory transcription factors were predicted by Ingenuity Pathway Analysis based on gene-expression profiles of terminal-Tem, Tem, and Tcm (Left), and relative expression of key predicted targets of T-bet (Right). (B) Summary of experimental model. (C) Frequency of splenic memory CD8 T cell subsets on day 72 of infection. (D) Ratio of recovered splenic OT-I cells (Left), and the relative abundance of terminal-Tem, Tem, and Tcm. (E) Congenically distinct P14 cells were transduced with Prdm1 or Cd19 (control) shRNA encoding retroviruses, mixed 1:1, and transferred into recipient mice subsequently infected with LCMV. Frequency of splenic memory CD8 T cell subsets on day 25 of infection. (F) Ratio of recovered P14 cells (Left), and the relative abundance of each subset (Right). (G) Congenically distinct CD4-Cre-Bcl6fl/fl P14 and Bcl6fl/fl P14 cells were mixed 1:1 and transferred to recipient mice subsequently infected with LCMV. Quantification of the frequency of splenic memory CD8 T cell subsets on day 35 of infection (Right). (H) Ratio of recovered P14 cells (Left), and the relative abundance of each subset (Right). (I) Congenically distinct dLck-Cre-Foxo1fl/fl P14 and Foxo1fl/fl P14 cells were mixed 1:1 and transferred to recipient mice subsequently infected with LCMV. Frequency of splenic memory CD8 T cell subsets on day 30 of infection (Right). (J) Ratio of recovered P14 cells (Left), and the relative abundance of each subset (Right). All data are from one representative experiment of two independent experiments with n = 4 to 6 per group (CI); n.s. not significant, **P < 0.01, ***P < 0.005. Graphs indicate mean ± SEM, and symbols represent an individual mouse.
Fig. 5.
Fig. 5.
Molecular phenotype of human terminal-Tem. (A) Representative expression levels of CD127 and CD27 in conventional Tem from 8 healthy donors. (B) PBMCs isolated from 6 healthy donors were analyzed by mass cytometry. Data were combined from all 6 donors, down-sampled to 3 × 10⁴ events, and UMAP highlighting heterogeneity of pregated CD45+CD3+CD8β+CD45RO+ T cells was constructed (Left). (CI) Single-cell RNA-seq analysis was performed on PBMCs from 10 healthy donors. (C) CD8 T cells were prefiltered based on expression of CD3D, CD3E, CD8A, and CD8B, and unbiased UMAP analysis revealed 15 distinct clusters (Left). Frequency of each cluster per donor. (D) Relative enrichment of the murine-derived terminal-Tem gene-expression signature (compared to both Tem and Tcm, see SI Appendix, Fig. S6B). (E) Relative expression of key molecules between the 15 distinct clusters from C. (F) Differential expression of highlighted genes uniquely up-regulated or down-regulated in cluster 0. (G) Relative expression of indicated genes from C. (H) GSEA of the human terminal-Tem gene-expression signature in murine populations, and (Right) relative expression in murine populations of leading edge genes up-regulated in both murine and human terminal-Tem. (I) GSEA of the human nonterminal-Tem gene-expression signature in murine populations. (J) Representative gating of human terminal-Tem, Tem, and Tcm populations. All data are from one representative experiment of 8 donors (A and J), 6 donors (B), and 10 donors (CI). *P < 0.05, ***P < 0.005. Graphs indicate mean ± SEM, and symbols represent an individual donor. NES, normalized enrichment score; FDR, false discovery rate.

Similar articles

Cited by

References

    1. Jameson S. C., Masopust D., Understanding subset diversity in T cell memory. Immunity 48, 214–226 (2018). - PMC - PubMed
    1. Kaech S. M., Cui W., Transcriptional control of effector and memory CD8+ T cell differentiation. Nat. Rev. Immunol. 12, 749–761 (2012). - PMC - PubMed
    1. Chang J. T., Wherry E. J., Goldrath A. W., Molecular regulation of effector and memory T cell differentiation. Nat. Immunol. 15, 1104–1115 (2014). - PMC - PubMed
    1. Wherry E. J., et al. , Lineage relationship and protective immunity of memory CD8 T cell subsets. Nat. Immunol. 4, 225–234 (2003). - PubMed
    1. Sallusto F., Lenig D., Förster R., Lipp M., Lanzavecchia A., Two subsets of memory T lymphocytes with distinct homing potentials and effector functions. Nature 401, 708–712 (1999). - PubMed

Publication types