

Characteristics and Expression Analyses of Trehalose-6-Phosphate Synthase Family in Prunus mume Reveal Genes Involved in Trehalose Biosynthesis and Drought Response
- PMID: 32977584
- PMCID: PMC7598203
- DOI: 10.3390/biom10101358
Characteristics and Expression Analyses of Trehalose-6-Phosphate Synthase Family in Prunus mume Reveal Genes Involved in Trehalose Biosynthesis and Drought Response
Abstract
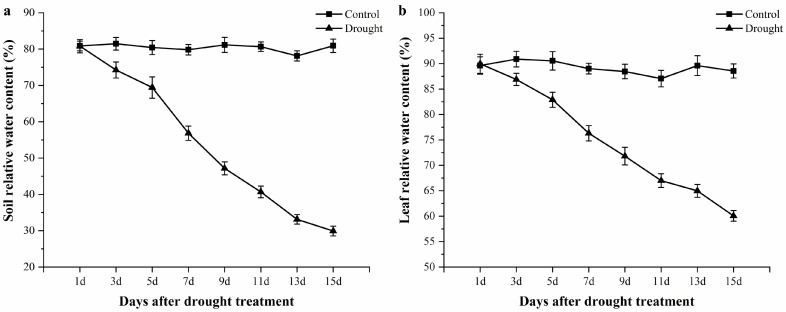
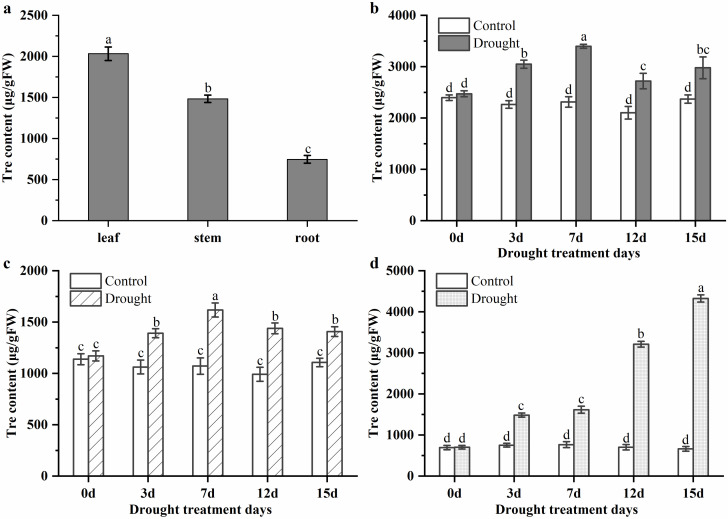
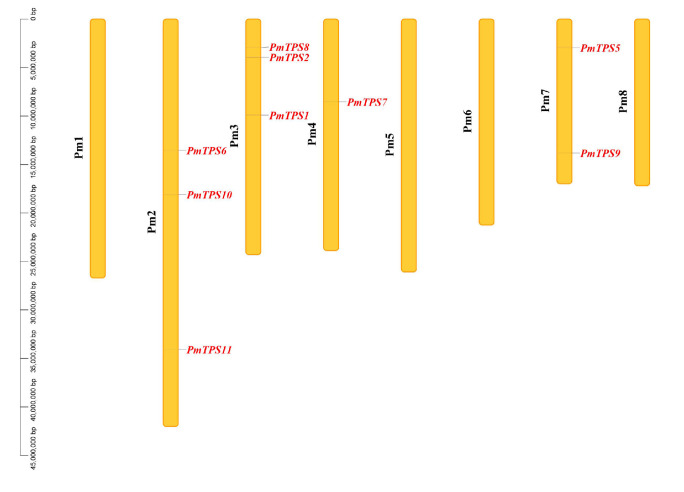
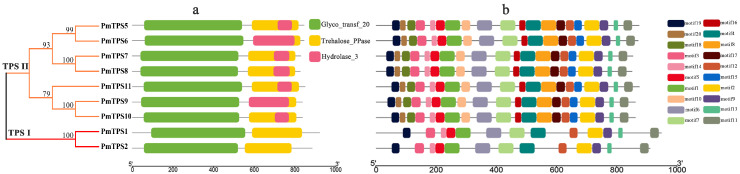
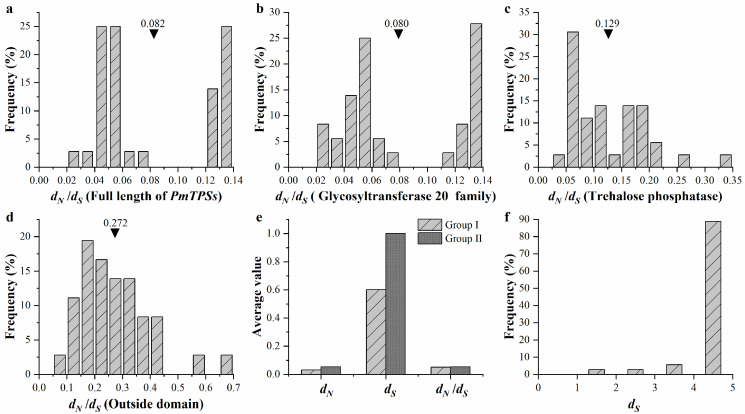
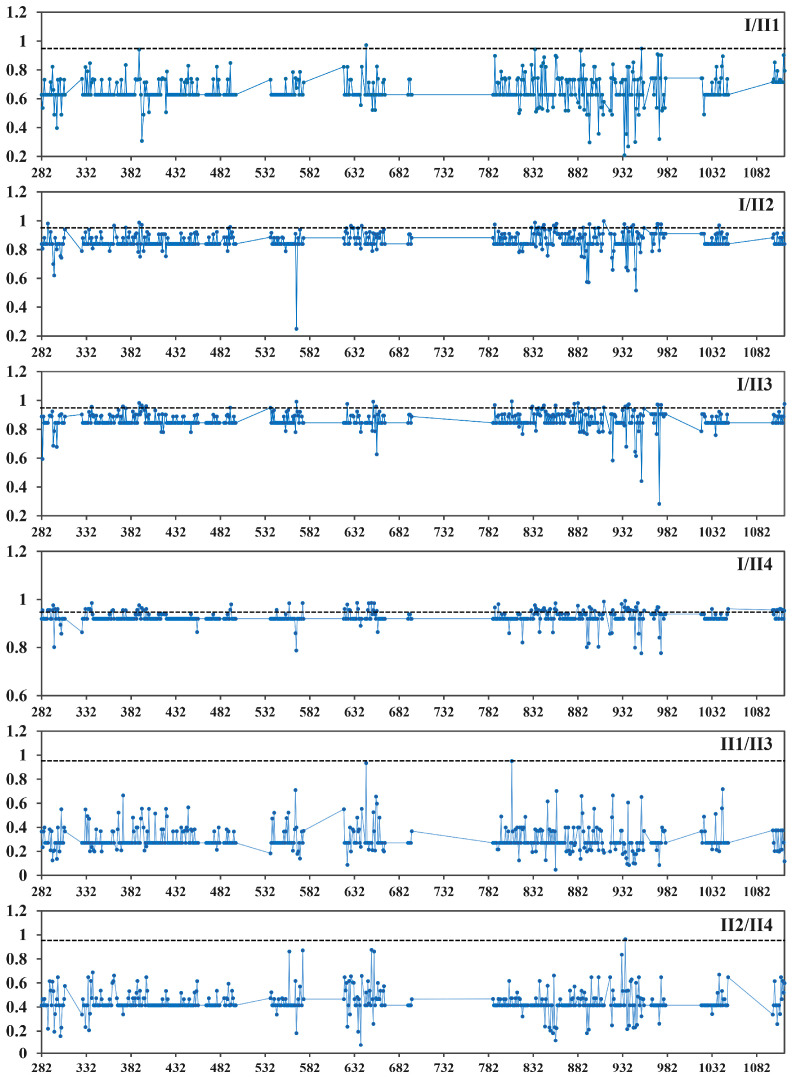
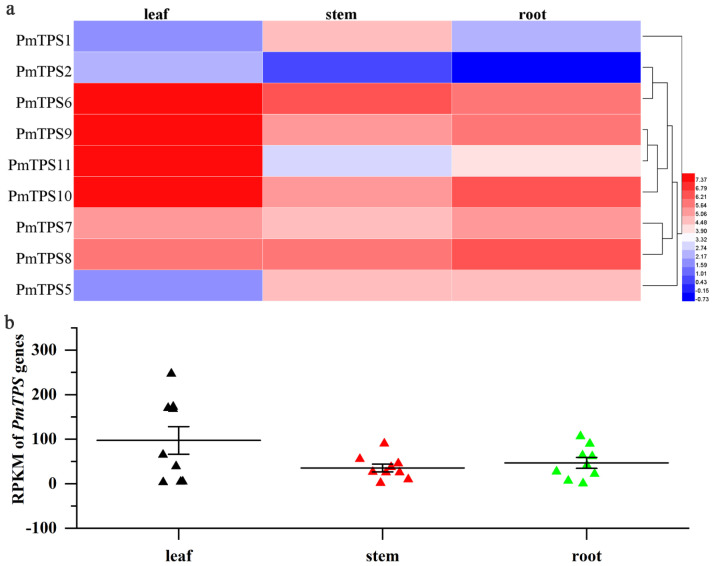
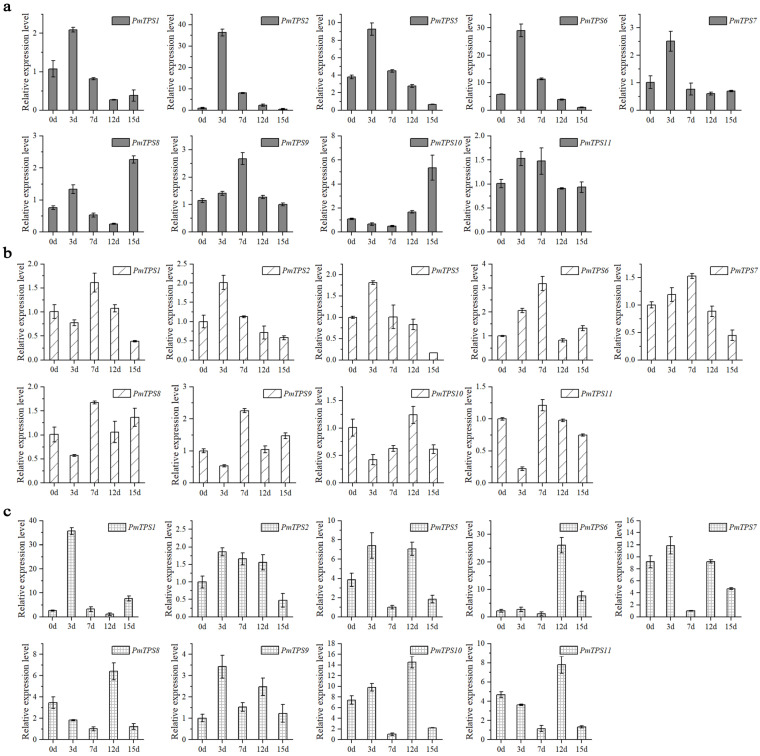
Trehalose and its key synthase (trehalose-6-phosphate synthase, TPS) can improve the drought tolerance of plants. However, little is known about the roles of trehalose and the TPS family in Prunus mume response to drought. In our study, we discovered that the trehalose content in leaf, root, and stem tissues significantly increased in P. mume in response to drought. Therefore, the characteristics and functions of the TPS family are worth investigating in P. mume. We identified nine TPS family members in P. mume, which were divided into two sub-families and characterized by gene structure, promoter elements, protein conserved domains, and protein motifs. We found that the Hydrolase_3 domain and several motifs were highly conserved in Group II instead of Group I. The distinctions between the two groups may result from selective constraints, which we estimated by the dN/dS (ω) ratio. The ω values of all the PmTPS family gene pairs were evaluated as less than 1, indicating that purity selection facilitated their divergence. A phylogenetic tree was constructed using 92 TPSs from 10 Rosaceae species, which were further divided into five clusters. Based on evolutionary analyses, the five clusters of TPS family proteins mainly underwent varied purity selection. The expression patterns of PmTPSs under drought suggested that the TPS family played an important role in the drought tolerance of P. mume. Combining the expression patterns of PmTPSs and the trehalose content changes in leaf, stem, and root tissues under normal conditions and drought stress, we found that the PmTPS2 and PmTPS6 mainly function in the trehalose biosynthesis in P. mume. Our findings not only provide valuable information about the functions of trehalose and TPSs in the drought response of P. mume, but they also contribute to the future drought breeding of P. mume.
Keywords: drought stress; evolution analysis; expression pattern; trehalose biosynthesis; trehalose-6-phosphate synthase.
Conflict of interest statement
The authors declare no conflict of interest.
Figures


Similar articles
-
Evolution and expression patterns of the trehalose-6-phosphate synthase gene family in drumstick tree (Moringa oleifera Lam.).Planta. 2018 Oct;248(4):999-1015. doi: 10.1007/s00425-018-2945-3. Epub 2018 Jul 13. Planta. 2018. PMID: 30006657
-
Genome-wide analysis of the Solanum tuberosum (potato) trehalose-6-phosphate synthase (TPS) gene family: evolution and differential expression during development and stress.BMC Genomics. 2017 Dec 1;18(1):926. doi: 10.1186/s12864-017-4298-x. BMC Genomics. 2017. PMID: 29191157 Free PMC article.
-
PagTPS1 and PagTPS10, the trehalose-6-phosphate synthase genes, increase trehalose content and enhance drought tolerance.Int J Biol Macromol. 2024 Nov;279(Pt 4):135518. doi: 10.1016/j.ijbiomac.2024.135518. Epub 2024 Sep 10. Int J Biol Macromol. 2024. PMID: 39260634
-
Trehalose biosynthesis in response to abiotic stresses.J Integr Plant Biol. 2008 Oct;50(10):1223-9. doi: 10.1111/j.1744-7909.2008.00736.x. J Integr Plant Biol. 2008. PMID: 19017109 Review.
-
Sensing trehalose biosynthesis in plants.Plant J. 1998 Apr;14(2):143-6. doi: 10.1046/j.1365-313x.1998.00140.x. Plant J. 1998. PMID: 9628011 Review.
Cited by
-
Identification of Trehalose-6-Phosphate Synthase (TPS) Genes Associated with Both Source-/Sink-Related Yield Traits and Drought Response in Rapeseed (Brassica napus L.).Plants (Basel). 2023 Feb 21;12(5):981. doi: 10.3390/plants12050981. Plants (Basel). 2023. PMID: 36903842 Free PMC article.
-
Hormonal Crosstalk and Root Suberization for Drought Stress Tolerance in Plants.Biomolecules. 2022 Jun 9;12(6):811. doi: 10.3390/biom12060811. Biomolecules. 2022. PMID: 35740936 Free PMC article. Review.
-
Tandem mass tag (TMT)-based quantitative proteomics analysis reveals the different responses of contrasting alfalfa varieties to drought stress.BMC Genomics. 2024 Aug 27;25(1):806. doi: 10.1186/s12864-024-10702-7. BMC Genomics. 2024. PMID: 39192174 Free PMC article.
References
-
- Zentella R., Mascorro-Gallardo J.O., Van Dijck P., Folch-Mallol J., Bonini B., Van Vaeck C., Gaxiola R., Covarrubias A.A., Nieto-Sotelo J., Thevelein J.M., et al. A Selaginella lepidophylla trehalose-6-phosphate synthase complements growth and stress-tolerance defects in a yeast tps1 mutant. Plant Physiol. 1999;119:1473–1482. doi: 10.1104/pp.119.4.1473. - DOI - PMC - PubMed
-
- El-Bashiti T., Hamamcı H., Öktem H.A., Yücel M. Biochemical analysis of trehalose and its metabolizing enzymes in wheat under abiotic stress conditions. Plant Sci. 2005;169:47–54. doi: 10.1016/j.plantsci.2005.02.024. - DOI
Publication types
MeSH terms
Substances
Grants and funding
LinkOut - more resources
Full Text Sources
