Repurposing anti-inflammasome NRTIs for improving insulin sensitivity and reducing type 2 diabetes development
- PMID: 32968070
- PMCID: PMC7511405
- DOI: 10.1038/s41467-020-18528-z
Repurposing anti-inflammasome NRTIs for improving insulin sensitivity and reducing type 2 diabetes development
Abstract
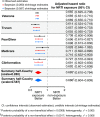
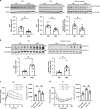
Innate immune signaling through the NLRP3 inflammasome is activated by multiple diabetes-related stressors, but whether targeting the inflammasome is beneficial for diabetes is still unclear. Nucleoside reverse-transcriptase inhibitors (NRTI), drugs approved to treat HIV-1 and hepatitis B infections, also block inflammasome activation. Here, we show, by analyzing five health insurance databases, that the adjusted risk of incident diabetes is 33% lower in patients with NRTI exposure among 128,861 patients with HIV-1 or hepatitis B (adjusted hazard ratio for NRTI exposure, 0.673; 95% confidence interval, 0.638 to 0.710; P < 0.0001; 95% prediction interval, 0.618 to 0.734). Meanwhile, an NRTI, lamivudine, improves insulin sensitivity and reduces inflammasome activation in diabetic and insulin resistance-induced human cells, as well as in mice fed with high-fat chow; mechanistically, inflammasome-activating short interspersed nuclear element (SINE) transcripts are elevated, whereas SINE-catabolizing DICER1 is reduced, in diabetic cells and mice. These data suggest the possibility of repurposing an approved class of drugs for prevention of diabetes.
Conflict of interest statement
J.A. is a co-founder of Inflammasome Therapeutics, iVeena Holdings, and iVeena Delivery Systems, and has received consultancy fees from Allergan, Biogen, Boehringer-Ingelheim, Immunovant, Janssen, Olix Pharmaceuticals, Retinal Solutions, and Saksin LifeSciences unrelated to this work. J.A., B.D.G., N.K., S.W., S.F., K.A., S.N., M.A., F.P. and B.J.F. are named as inventors on patent applications filed by or patents issued to the University of Virginia or the University of Kentucky relating to DICER1,
Figures


Similar articles
-
High Endogenously Synthesized N-3 Polyunsaturated Fatty Acids in Fat-1 Mice Attenuate High-Fat Diet-Induced Insulin Resistance by Inhibiting NLRP3 Inflammasome Activation via Akt/GSK-3β/TXNIP Pathway.Molecules. 2022 Sep 27;27(19):6384. doi: 10.3390/molecules27196384. Molecules. 2022. PMID: 36234919 Free PMC article.
-
Nucleoside reverse transcriptase inhibitors possess intrinsic anti-inflammatory activity.Science. 2014 Nov 21;346(6212):1000-3. doi: 10.1126/science.1261754. Science. 2014. PMID: 25414314 Free PMC article.
-
A casein hydrolysate protects mice against high fat diet induced hyperglycemia by attenuating NLRP3 inflammasome-mediated inflammation and improving insulin signaling.Mol Nutr Food Res. 2016 Nov;60(11):2421-2432. doi: 10.1002/mnfr.201501054. Epub 2016 Sep 8. Mol Nutr Food Res. 2016. PMID: 27390025
-
Mutational patterns in the HIV genome and cross-resistance following nucleoside and nucleotide analogue drug exposure.Antivir Ther. 2001;6 Suppl 3:25-44. Antivir Ther. 2001. PMID: 11678471 Review.
-
Structure, Synthesis and Inhibition Mechanism of Nucleoside Analogues as HIV-1 Reverse Transcriptase Inhibitors (NRTIs).ChemMedChem. 2021 Mar 3;16(5):743-766. doi: 10.1002/cmdc.202000695. Epub 2021 Feb 9. ChemMedChem. 2021. PMID: 33230979 Review.
Cited by
-
Effect of metabolic status on response to SIV infection and antiretroviral therapy in nonhuman primates.JCI Insight. 2024 Aug 8;9(18):e181968. doi: 10.1172/jci.insight.181968. JCI Insight. 2024. PMID: 39115937 Free PMC article.
-
T-cell immunity against senescence: potential role and perspectives.Front Immunol. 2024 Mar 5;15:1360109. doi: 10.3389/fimmu.2024.1360109. eCollection 2024. Front Immunol. 2024. PMID: 38504990 Free PMC article. Review.
-
A Mechanism Leading to Changes in Copy Number Variations Affected by Transcriptional Level Might Be Involved in Evolution, Embryonic Development, Senescence, and Oncogenesis Mediated by Retrotransposons.Front Cell Dev Biol. 2021 Feb 11;9:618113. doi: 10.3389/fcell.2021.618113. eCollection 2021. Front Cell Dev Biol. 2021. PMID: 33644055 Free PMC article.
-
The role of retrotransposable elements in ageing and age-associated diseases.Nature. 2021 Aug;596(7870):43-53. doi: 10.1038/s41586-021-03542-y. Epub 2021 Aug 4. Nature. 2021. PMID: 34349292 Free PMC article. Review.
-
Kamuvudine-9 Protects Retinal Structure and Function in a Novel Model of Experimental Rhegmatogenous Retinal Detachment.Invest Ophthalmol Vis Sci. 2023 May 1;64(5):3. doi: 10.1167/iovs.64.5.3. Invest Ophthalmol Vis Sci. 2023. PMID: 37129905 Free PMC article.
References
-
- International Diabetes Federation. IDF Diabetes Atlas. 9th edn, (International Diabetes Federation, 2019).
-
- Pickup JC, Crook MA. Is type II diabetes mellitus a disease of the innate immune system? Diabetologia. 1998;41:1241–1248. - PubMed
-
- Donath MY, Shoelson SE. Type 2 diabetes as an inflammatory disease. Nat. Rev. Immunol. 2011;11:98–107. - PubMed
-
- Masters SL, Latz E, O’Neill LA. The inflammasome in atherosclerosis and type 2 diabetes. Sci. Transl. Med. 2011;3:81ps17. - PubMed
Publication types
MeSH terms
Substances
Grants and funding
- R01 EY032512/EY/NEI NIH HHS/United States
- R01 DK096076/DK/NIDDK NIH HHS/United States
- P01 HL120840/HL/NHLBI NIH HHS/United States
- R00 EY024336/EY/NEI NIH HHS/United States
- K99 EY024336/EY/NEI NIH HHS/United States
- UL1 RR033173/RR/NCRR NIH HHS/United States
- DP1 GM114862/GM/NIGMS NIH HHS/United States
- R01 EY028027/EY/NEI NIH HHS/United States
- R01 CA165609/CA/NCI NIH HHS/United States
- R21 EY030651/EY/NEI NIH HHS/United States
- R01 EY022238/EY/NEI NIH HHS/United States
- R01 EY029799/EY/NEI NIH HHS/United States
- P30 DK092926/DK/NIDDK NIH HHS/United States
- R01 EY031039/EY/NEI NIH HHS/United States
- T32 HL091812/HL/NHLBI NIH HHS/United States
- R01 EY024068/EY/NEI NIH HHS/United States
LinkOut - more resources
Full Text Sources
Medical

