. 2020 Sep 22;32(12):108186.
doi: 10.1016/j.celrep.2020.108186.

Coordinated Viral Control by Cytotoxic Lymphocytes Ensures Optimal Adaptive NK Cell Responses

Affiliations

Coordinated Viral Control by Cytotoxic Lymphocytes Ensures Optimal Adaptive NK Cell Responses

Carlos Diaz-Salazar et al. Cell Rep. .

Abstract

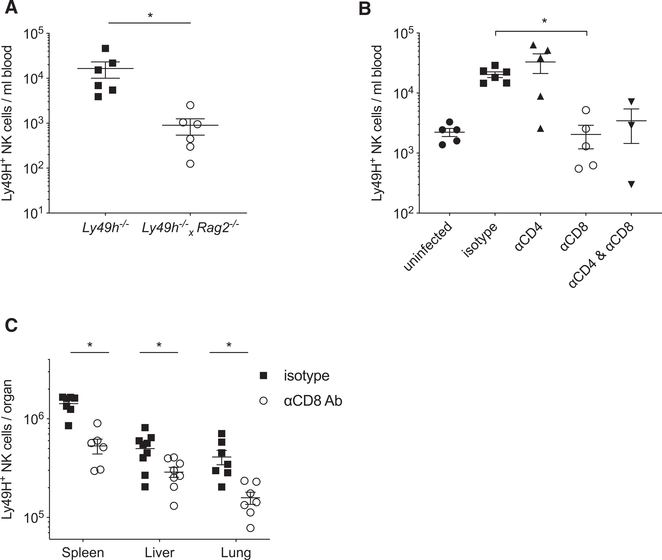
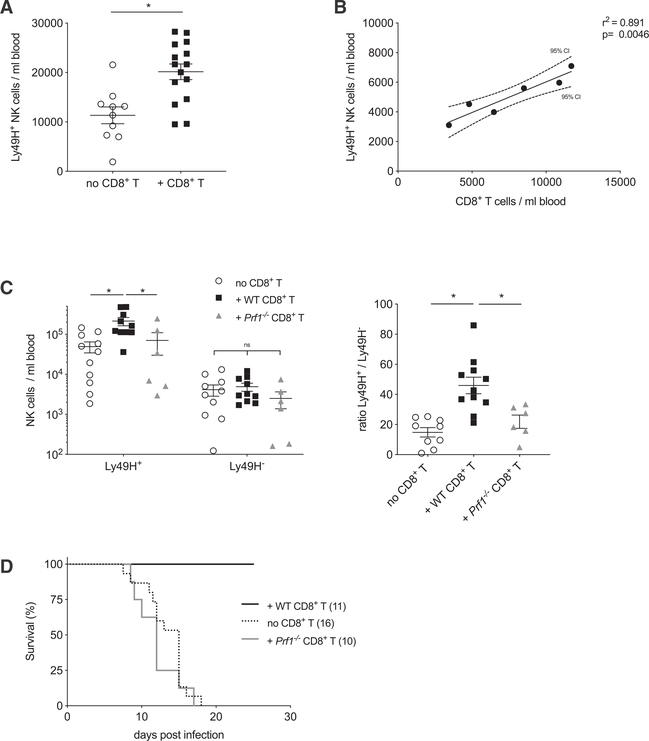
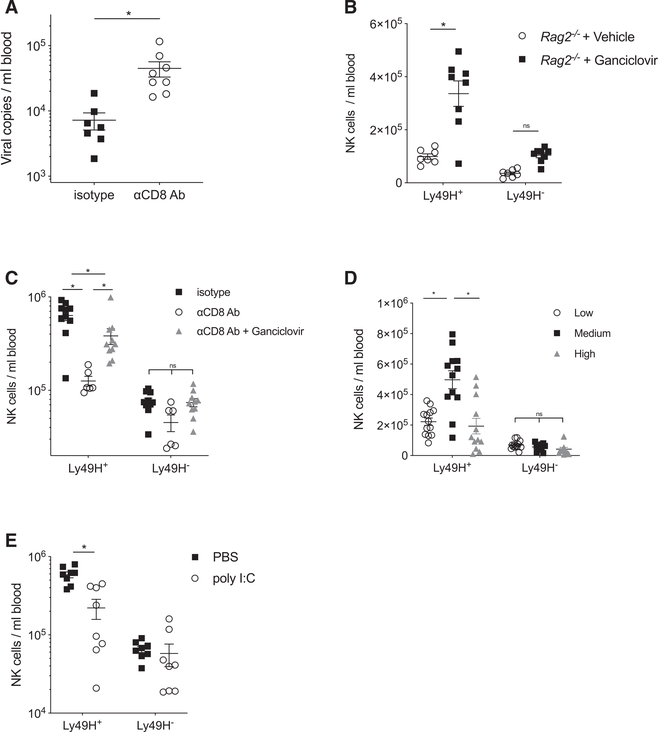
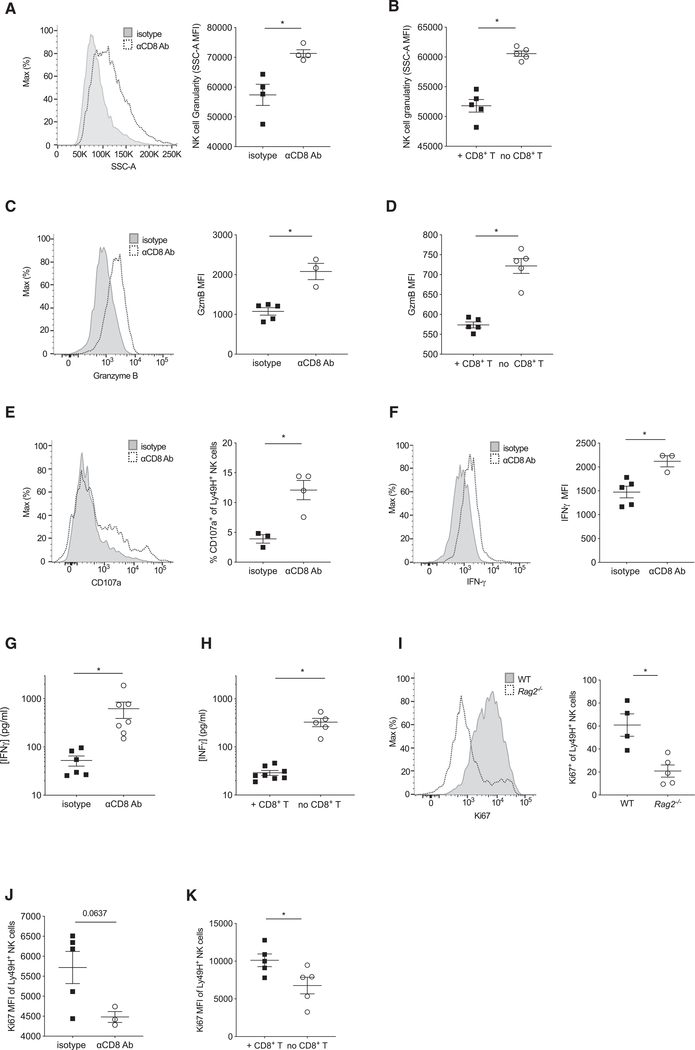
Natural killer (NK) cells play a critical role in controlling viral infections, coordinating the response of innate and adaptive immune systems. They also possess certain features of adaptive lymphocytes, such as undergoing clonal proliferation. However, it is not known whether this adaptive NK cell response can be modulated by other lymphocytes during viral exposure. Here, we show that the clonal expansion of NK cells during mouse cytomegalovirus infection is severely blunted in the absence of cytotoxic CD8+ T cells. This correlates with higher viral burden and an increased pro-inflammatory milieu, which maintains NK cells in a hyper-activated state. Antiviral therapy rescues NK cell expansion in the absence of CD8+ T cells, suggesting that high viral loads have detrimental effects on adaptive NK cell responses. Altogether, our data support a mechanism whereby cytotoxic innate and adaptive lymphocytes cooperate to ensure viral clearance and the establishment of robust clonal NK cell responses.

Keywords: CD8(+) T cell; MCMV; antivirals; cooperation; inflammation; natural killer cell.


Conflict of interest statement

Declaration of Interests The authors declare no competing interests.

Figures

Figure 1.
Figure 1.. The Adaptive Immune System Is Required for Optimal NK Cell Expansion
(A) 4 × 10⁵ purified NK cells were transferred into congenically distinct Ly49H-deficient (Ly49h−/−) mice, or T-cell- and B-cell-deficient mice crossed with Ly49H-deficient mice (Ly49h−/− × Rag2−/−). One day after transfer, mice were challenged with MCMV, and the number of transferred Ly49H+ NK cells was quantified in peripheral blood 7 days post-infection (PI). Data are pooled from two independent experiments with three mice per group. (B) Approximately 1.5 × 10⁵ splenic NK cells were transferred into congenically distinct Ly49h−/− mice, treated with αCD8-depleting antibody, αCD4-depleting antibody, both, or isotype control and challenged with MCMV 1 day after transfer. The number of transferred Ly49H+ NK cells was quantified in peripheral blood at day 7 PI. Data are pooled from two independent experiments with three mice per group. (C) WT mice treated with αCD8-depleting antibody or isotype control antibody were challenged with MCMV, and the number of endogenous Ly49H+ NK cells was quantified in various peripheral organs at day 6 PI. Data are pooled from two independent experiments with three or four mice per group. Graphs present individual data points as scatter dot plots, and error bars show mean ± SEM. Statistical differences were calculated with a two-way ANOVA (A and C) and a one-way ANOVA (B). A p value of <0.05 was used as the significance cut-off and is indicated with a single asterisk (*). See also Figure S1.
Figure 2.
Figure 2.. Cytotoxic CD8+ T Cells Are Sufficient and Required to Promote NK Cell Expansion
(A) 3 × 10⁶ purified CD8+ T cells were transferred into T-cell- and B-cell-deficient mice (Rag2−/−) and challenged with MCMV 10 days after transfer. The number of endogenous Ly49H+ NK cells was quantified in peripheral blood at day 14 PI. Data are pooled from three independent experiments with three to seven mice per group. Statistical differences were calculated with an unpaired t test. (B) Linear correlation between the number of endogenous Ly49H+ NK cells and the number of CD8+ T cells transferred into Rag2−/− recipients. Data are representative of three independent experiments with six to eight mice per group. Linear correlation was determined using Pearson’s correlation coefficient. (C) Rag2−/− × Il2rg−/− mice were reconstituted with 3 × 10⁶ purified WT CD8+ T cells, perforin-deficient (Prf1−/−) CD8+ T cells, or no cells. Ten days after transfer, all recipients received 5 × 10⁵ purified NK cells and were challenged with MCMV 1 day later. The number (left) and ratio (right) of transferred Ly49H+ and Ly49H NK cells were quantified in peripheral blood at day 7 PI. Data are pooled from two independent experiments with three to five mice per group. Statistical differences were calculated with a two-way ANOVA. (D) Same as in (C), but purified CD8+ T cells and NK cells were transferred into Rag2−/− × Il2rg−/− recipients and survival was calculated using the Kaplan- Meier estimator. Data are pooled from three independent experiments with three to five mice per group. Graphs present individual data points as scatter dot plots, and error bars show mean ± SEM. A p value of <0.05 was used as the significance cut-off and is indicated with a single asterisk (*). See also Figure S1.
Figure 3.
Figure 3.. High Viral Load in CD8+ T-Cell-Depleted Mice Restricts NK Cell Expansion
(A) WT mice treated with αCD8-depleting antibody or isotype control antibody were challenged with MCMV, and viral titers were quantified from peripheral blood at day 6 PI. Data are pooled from two independent experiments with four or five mice per group. (B) Rag2−/− mice were challenged with MCMV and treated daily with the antiviral drug ganciclovir or vehicle control starting from day 3 PI. The number of endogenous Ly49H+ and Ly49H NK cells was quantified in peripheral blood at day 7 PI. Data are representative of two independent experiments with seven or eight mice per group. (C) WT mice treated with αCD8-depleting antibody or isotype control antibody were challenged with MCMV. αCD8-treated mice were treated daily with ganciclovir or vehicle control starting from day 3 PI. The number of endogenous Ly49H+ and Ly49H NK cells was quantified in peripheral blood at day 7 PI. Data are pooled from three independent experiments with three to five mice per group. (D) WT mice were treated with a regular viral dose (Medium) or a 5- to 10-fold higher (High) or lower (Low) dose, and the number of endogenous Ly49H+ and Ly49H NK cells was quantified in peripheral blood at day 6 PI. Data are pooled from three independent experiments with four or five mice per group. (E) WT mice were challenged with MCMV and treated daily with the TLR3 agonist poly I:C or vehicle control starting from day 4 PI. The number of endogenous Ly49H+ and Ly49H NK cells was quantified in peripheral blood at day 7 PI. Data are representative of two independent experiments with three to five mice per group. Graphs present individual data points as scatter dot plots, and error bars show mean ± SEM. Statistical differences were calculated with an unpaired t test (A) and with a two-way ANOVA (B–E). A p value of <0.05 was used as the significance cut-off and is indicated with a single asterisk (*). See also Figure S2.
Figure 4.
Figure 4.. Unchecked Viral Infection Locks NK Cells in an Overactivated State
(A and C) WT mice treated with αCD8-depleting antibody or isotype control antibody were challenged with MCMV, and the granularity (A) and granzyme B content (C) of splenic NK cells was assessed at day 6 PI. Left: representative histogram. Right: quantification of these markers on Ly49H+ NK cells. Data are representative of three independent experiments with four or five mice per group. (B and D) Lymphocyte-deficient mice reconstituted with NK cells, along with WT CD8+ T cells or no cells, were challenged with MCMV, and the granularity (B) and granzyme B content (D) of splenic Ly49H+ NK cells were assessed at day 10 PI. Data are representative of two independent experiments with four to six mice per group. (E and F) Splenic NK cells from WT mice treated with αCD8-depleting antibody or isotype control antibody were assessed at day 6 PI for recent events of degranulation (as measured by CD107a expression) (E) and their ability to produce IFN-γ (F). Left: representative histogram. Right: quantification of these markers on Ly49H+ NK cells. Data are pooled from two independent experiments with three to five mice per group. (G) WT mice treated with αCD8-depleting antibody or isotype control antibody were challenged with MCMV and IFN-γ quantified in serum at day 6 PI. Data are pooled from two independent experiments with four or five mice per group. (H) Rag2−/− mice were reconstituted with 3 × 10⁶ CD8+ T cells 10 days prior to MCMV infection, and IFN-γ was quantified in serum at day 7 PI. Data are representative of two independent experiments with five to eight mice per group. (I–K) WT and Rag2−/− mice (I), WT mice treated with αCD8-depleting antibody or isotype control (J), and Rag2−/− mice reconstituted with CD8+ T cells (K) were challenged with MCMV, and the proliferative marker Ki67 was quantified in circulating Ly49H+ NK cells at day 7 PI. Data are representative of two independent experiments with three to five mice per group. Graphs present individual data points as scatter dot plots, and error bars show mean ± SEM. Statistical differences were calculated with an unpaired t test. A p value of <0.05 was used as the significance cut-off and is indicated with a single asterisk (*). See also Figure S2.

Similar articles

Cited by

References

    1. Abel AM, Yang C, Thakar MS, and Malarkannan S (2018). Natural killer cells: development, maturation, and clinical utilization. Front. Immunol 9, 1869. - PMC - PubMed
    1. Arase H, Mocarski ES, Campbell AE, Hill AB, and Lanier LL (2002). Direct recognition of cytomegalovirus by activating and inhibitory NK cell receptors. Science 296, 1323–1326. - PubMed
    1. Barry KC, Hsu J, Broz ML, Cueto FJ, Binnewies M, Combes AJ, Nelson AE, Loo K, Kumar R, Rosenblum MD, et al. (2018). A natural killer-dendritic cell axis defines checkpoint therapy-responsive tumor microenvironments. Nat. Med. 24, 1178–1191. - PMC - PubMed
    1. Beaulieu AM, Zawislak CL, Nakayama T, and Sun JC (2014). The transcription factor Zbtb32 controls the proliferative burst of virus-specific natural killer cells responding to infection. Nat. Immunol. 15, 546–553. - PMC - PubMed
    1. Biron CA, Byron KS, and Sullivan JL (1989). Severe herpesvirus infections in an adolescent without natural killer cells. N. Engl. J. Med. 320, 1731–1735. - PubMed

Publication types

MeSH terms