

Fermented Oyster Extract Promotes Insulin-Like Growth Factor-1-Mediated Osteogenesis and Growth Rate
- PMID: 32962034
- PMCID: PMC7551862
- DOI: 10.3390/md18090472
Fermented Oyster Extract Promotes Insulin-Like Growth Factor-1-Mediated Osteogenesis and Growth Rate
Abstract
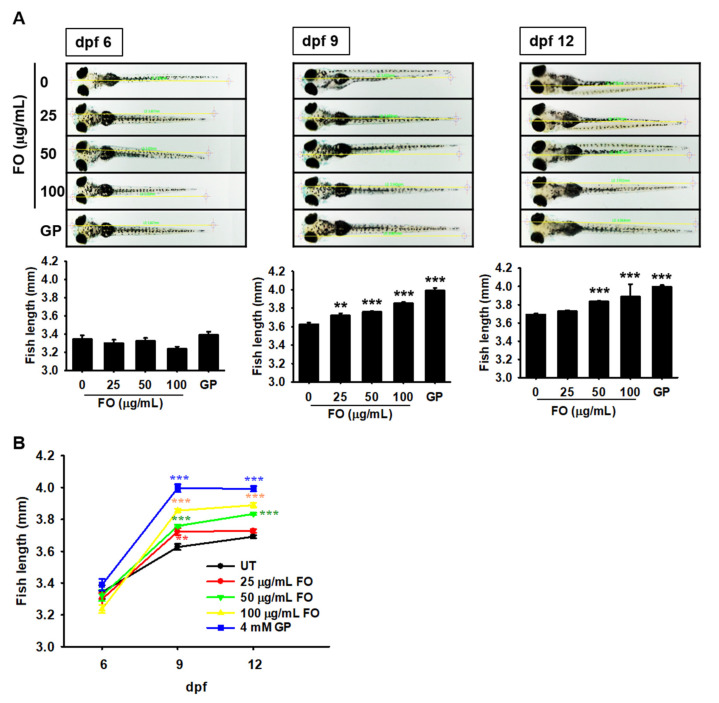
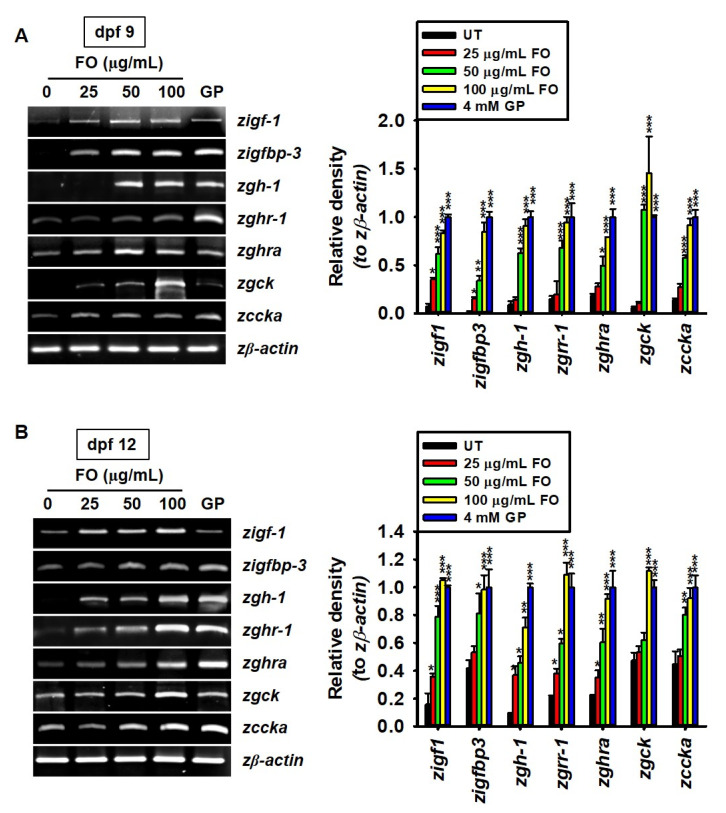
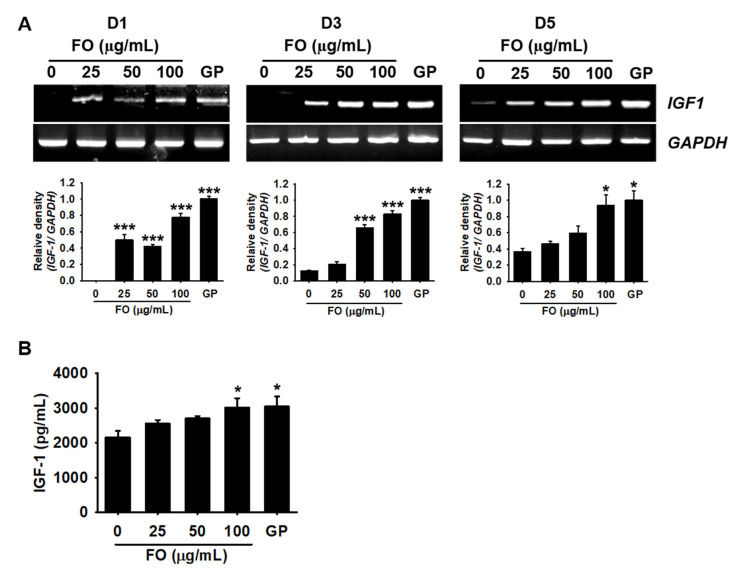
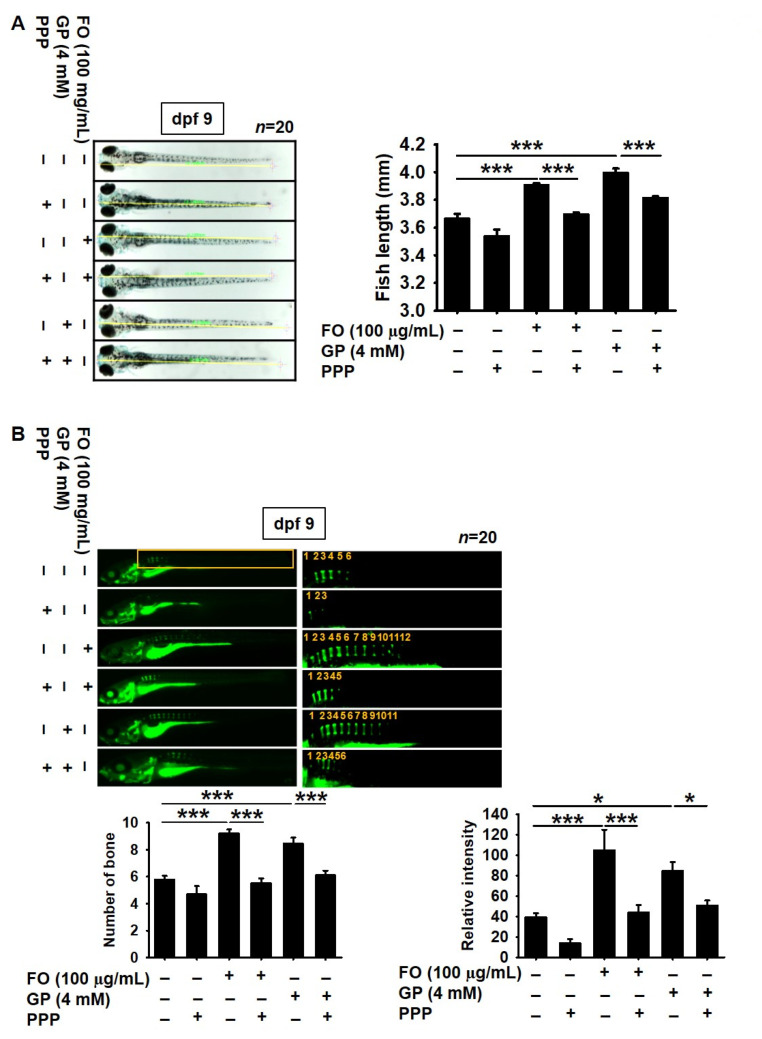
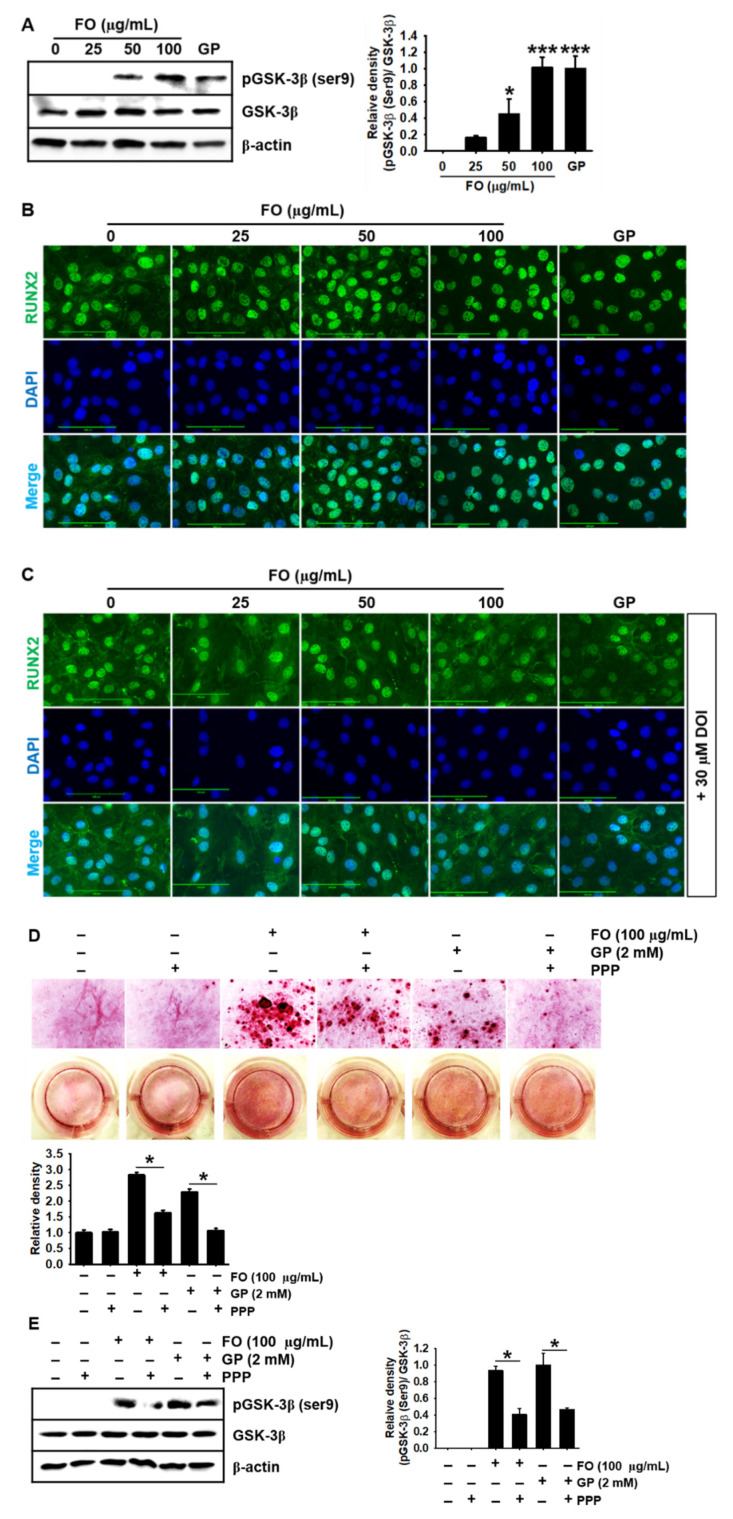
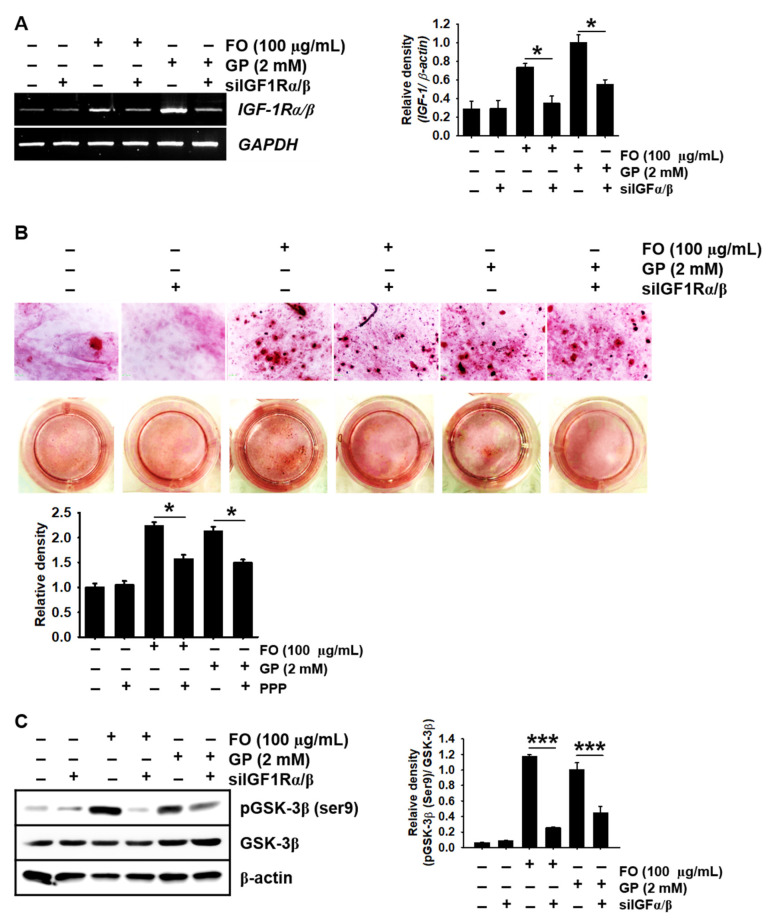
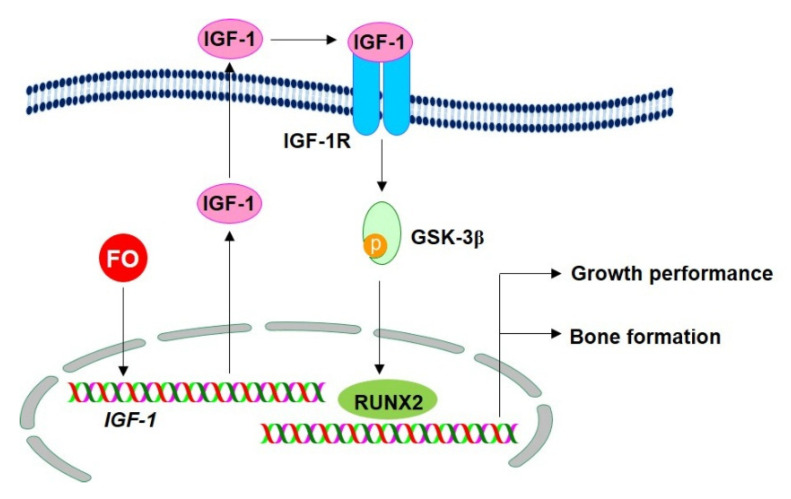
Fermented oyster (Crassostrea gigas) extract (FO) prevents ovariectomy-induced osteoporosis by inhibiting osteoclastogenesis and activating osteogenesis. However, the molecular mechanisms underlying FO-mediated bone formation and growth rate are unclear. In the current study, we found that FO significantly upregulated the expression of growth-promoting genes in zebrafish larvae including insulin-like growth factor 1 (zigf-1), insulin-like growth factor binding protein 3 (zigfbp-3), growth hormone-1 (zgh-1), growth hormone receptor-1 (zghr-1), growth hormone receptor alpha (zghra), glucokinase (zgck), and cholecystokinin (zccka). In addition, zebrafish larvae treated with 100 μg/mL FO increased in total body length (3.89 ± 0.13 mm) at 12 days post fertilization (dpf) compared to untreated larvae (3.69 ± 0.02 mm); this effect was comparable to that of the β-glycerophosphate-treated zebrafish larvae (4.00 ± 0.02 mm). Furthermore, FO time- and dose-dependently increased the extracellular release of IGF-1 from preosteoblast MC3T3-E1 cells, which was accompanied by high expression of IGF-1. Pharmacological inhibition of IGF-1 receptor (IGF-1R) using picropodophyllin (PPP) significantly reduced FO-mediated vertebrae formation (from 9.19 ± 0.31 to 5.53 ± 0.35) and growth performance (from 3.91 ± 0.02 to 3.69 ± 0.01 mm) in zebrafish larvae at 9 dpf. Similarly, PPP significantly decreased FO-induced calcium deposition in MC3T3-E1 cells by inhibiting GSK-3β phosphorylation at Ser9. Additionally, DOI hydrochloride, a potent stabilizer of GSK-3β, reduced FO-induced nuclear translocation of RUNX2. Transient knockdown of IGF-1Rα/β using specific silencing RNA also resulted in a significant decrease in calcium deposition and reduction in GSK-3β phosphorylation at Ser9 in MC3T3-E1 cells. Altogether, these results indicate that FO increased phosphorylated GSK-3β at Ser9 by activating the autocrine IGF-1-mediated IGF-1R signaling pathway, thereby promoting osteogenesis and growth performance. Therefore, FO is a potential nutritional supplement for bone formation and growth.
Keywords: Crassostrea gigas; GSK-3β; IGF-1; RUNX2; growth performance; osteogenesis.
Conflict of interest statement
The authors declare no conflict of interest.
Figures
Similar articles
-
Gamma-Aminobutyric Acid (GABA) Promotes Growth in Zebrafish Larvae by Inducing IGF-1 Expression via GABAA and GABAB Receptors.Int J Mol Sci. 2021 Oct 19;22(20):11254. doi: 10.3390/ijms222011254. Int J Mol Sci. 2021. PMID: 34681914 Free PMC article.
-
Fermented Oyster Extract Promotes Osteoblast Differentiation by Activating the Wnt/β-Catenin Signaling Pathway, Leading to Bone Formation.Biomolecules. 2019 Nov 6;9(11):711. doi: 10.3390/biom9110711. Biomolecules. 2019. PMID: 31698882 Free PMC article.
-
Fisetin promotes osteoblast differentiation and osteogenesis through GSK-3β phosphorylation at Ser9 and consequent β-catenin activation, inhibiting osteoporosis.Biochem Pharmacol. 2021 Oct;192:114676. doi: 10.1016/j.bcp.2021.114676. Epub 2021 Jul 10. Biochem Pharmacol. 2021. PMID: 34256044
-
Drug development targeting the glycogen synthase kinase-3beta (GSK-3beta)-mediated signal transduction pathway: the role of GSK-3beta in the maintenance of steady-state levels of insulin receptor signaling molecules and Na(v)1.7 sodium channel in adrenal chromaffin cells.J Pharmacol Sci. 2009 Feb;109(2):157-61. doi: 10.1254/jphs.08r20fm. Epub 2009 Jan 29. J Pharmacol Sci. 2009. PMID: 19179806 Review.
-
Insulin-Like Growth Factors in the Pathogenesis of Neurological Diseases in Children.Int J Mol Sci. 2017 Sep 26;18(10):2056. doi: 10.3390/ijms18102056. Int J Mol Sci. 2017. PMID: 28954393 Free PMC article. Review.
Cited by
-
Gamma-Aminobutyric Acid (GABA) Promotes Growth in Zebrafish Larvae by Inducing IGF-1 Expression via GABAA and GABAB Receptors.Int J Mol Sci. 2021 Oct 19;22(20):11254. doi: 10.3390/ijms222011254. Int J Mol Sci. 2021. PMID: 34681914 Free PMC article.
-
Drug discovery in spinal cord injury-induced osteoporosis: a text mining-based study.Ann Transl Med. 2022 Jul;10(13):733. doi: 10.21037/atm-21-6900. Ann Transl Med. 2022. PMID: 35957736 Free PMC article.
-
Nesfatin-1 enhances vascular smooth muscle calcification through facilitating BMP-2 osteogenic signaling.Cell Commun Signal. 2024 Oct 11;22(1):488. doi: 10.1186/s12964-024-01873-7. Cell Commun Signal. 2024. PMID: 39394127 Free PMC article.
-
Fermented Oyster Extract Attenuated Dexamethasone-Induced Muscle Atrophy by Decreasing Oxidative Stress.Molecules. 2021 Nov 25;26(23):7128. doi: 10.3390/molecules26237128. Molecules. 2021. PMID: 34885708 Free PMC article.
-
Metabolic bone disorders and the promise of marine osteoactive compounds.Cell Mol Life Sci. 2023 Dec 20;81(1):11. doi: 10.1007/s00018-023-05033-x. Cell Mol Life Sci. 2023. PMID: 38117357 Free PMC article. Review.
References
-
- Serra C., Bhasin S., Tangherlini F., Barton E.R., Ganno M., Zhang A., Shansky J., VanDenburgh H.H., Travison T.G., Jasuja R., et al. The role of GH and IGF-I in mediating anabolic effects of testosterone on androgen-responsive muscle. Endocrinology. 2011;152:193–206. doi: 10.1210/en.2010-0802. - DOI - PMC - PubMed
Publication types
MeSH terms
Substances
Grants and funding
LinkOut - more resources
Full Text Sources
Molecular Biology Databases
Miscellaneous
