Comparative Study
. 2020 Sep 21;16(9):e1008803.
doi: 10.1371/journal.ppat.1008803. eCollection 2020 Sep.

Closely related reovirus lab strains induce opposite expression of RIG-I/IFN-dependent versus -independent host genes, via mechanisms of slow replication versus polymorphisms in dsRNA binding σ3 respectively

Affiliations
Comparative Study

Closely related reovirus lab strains induce opposite expression of RIG-I/IFN-dependent versus -independent host genes, via mechanisms of slow replication versus polymorphisms in dsRNA binding σ3 respectively

Adil Mohamed et al. PLoS Pathog. .

Abstract

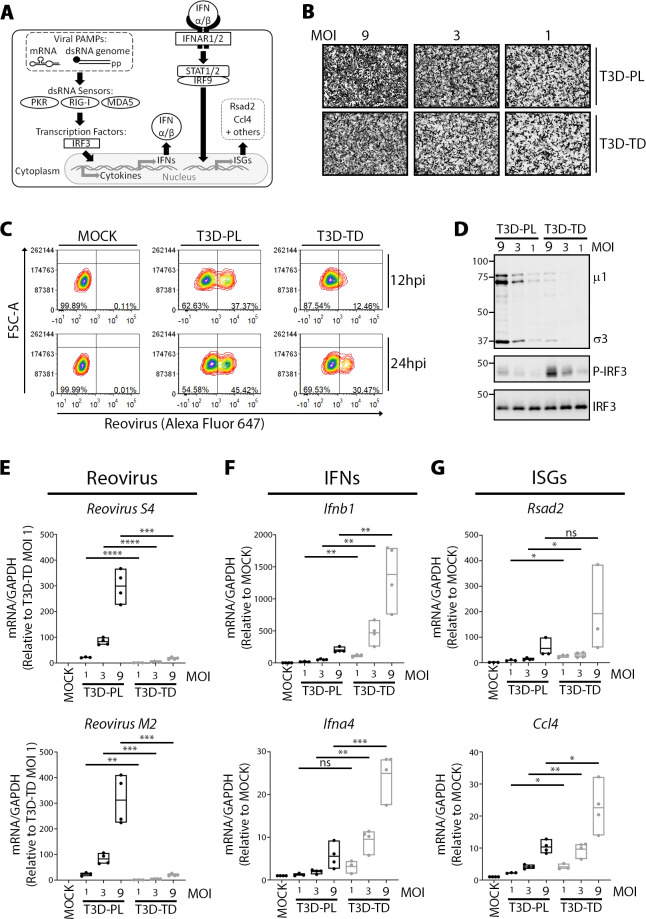
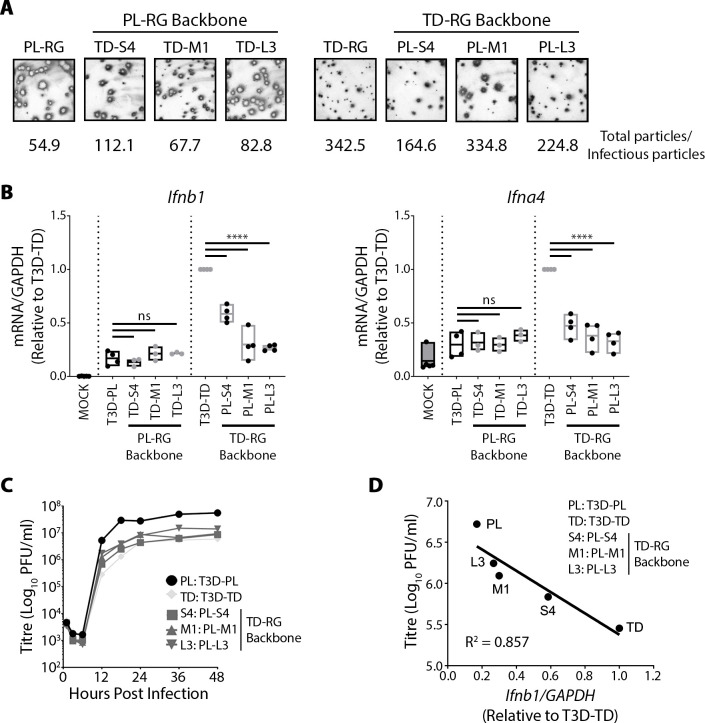
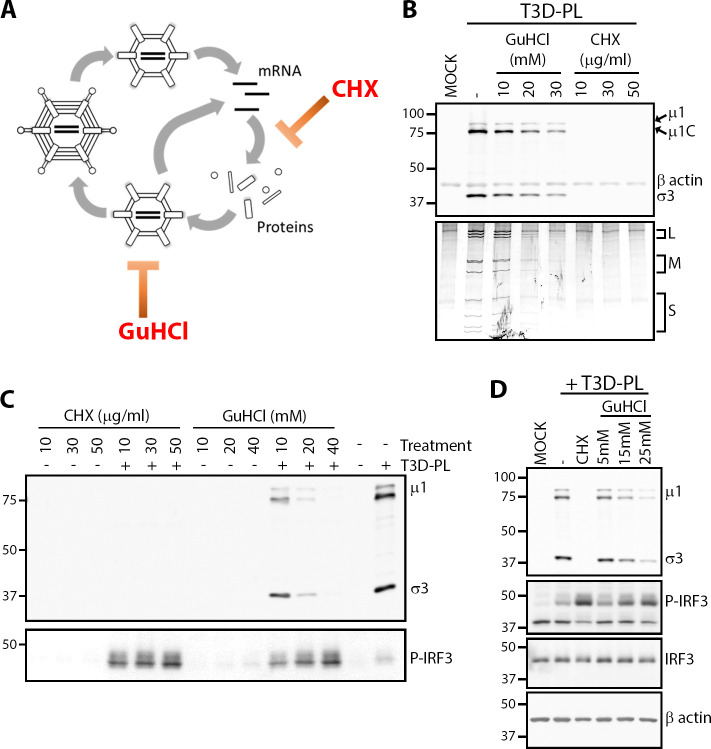
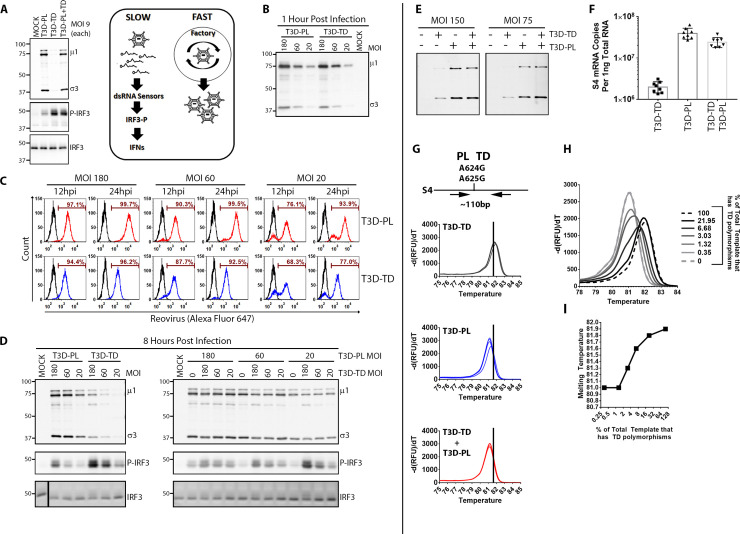
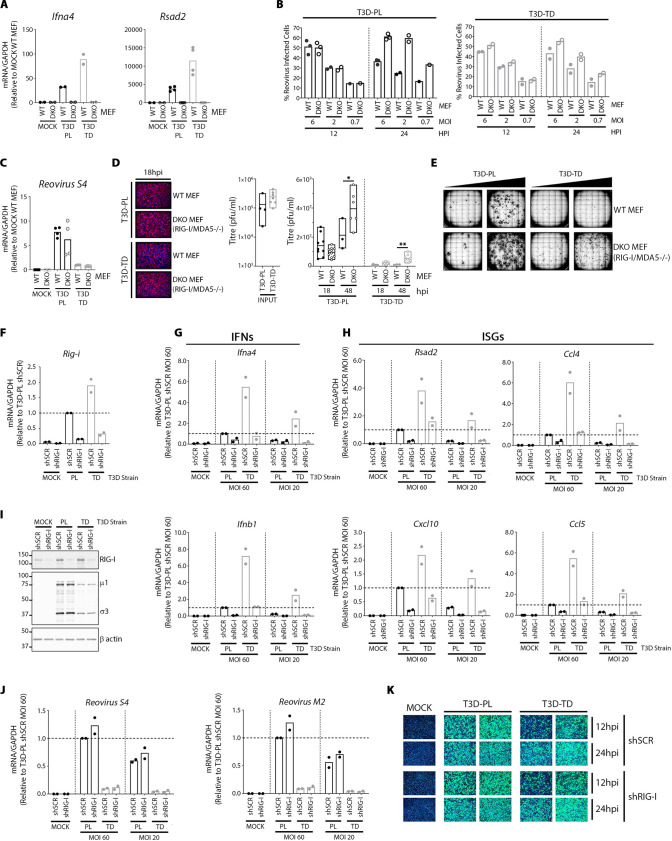
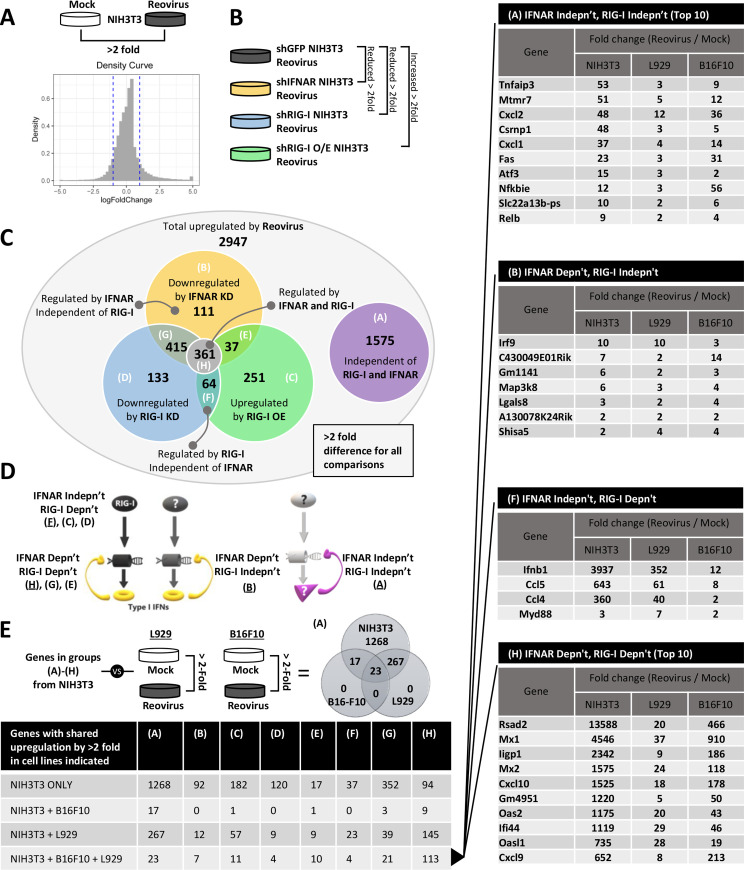
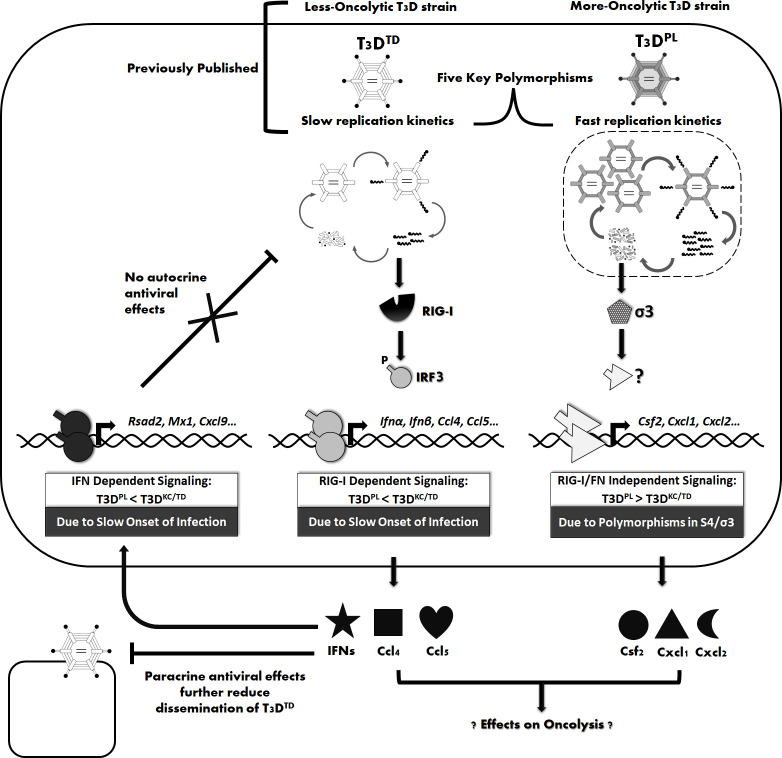
The Dearing isolate of Mammalian orthoreovirus (T3D) is a prominent model of virus-host relationships and a candidate oncolytic virotherapy. Closely related laboratory strains of T3D, originating from the same ancestral T3D isolate, were recently found to exhibit significantly different oncolytic properties. Specifically, the T3DPL strain had faster replication kinetics in a panel of cancer cells and improved tumor regression in an in vivo melanoma model, relative to T3DTD. In this study, we discover that T3DPL and T3DTD also differentially activate host signalling pathways and downstream gene transcription. At equivalent infectious dose, T3DTD induces higher IRF3 phosphorylation and expression of type I IFNs and IFN-stimulated genes (ISGs) than T3DPL. Using mono-reassortants with intermediate replication kinetics and pharmacological inhibitors of reovirus replication, IFN responses were found to inversely correlate with kinetics of virus replication. In other words, slow-replicating T3D strains induce more IFN signalling than fast-replicating T3D strains. Paradoxically, during co-infections by T3DPL and T3DTD, there was still high IRF3 phosphorylation indicating a phenodominant effect by the slow-replicating T3DTD. Using silencing and knock-out of RIG-I to impede IFN, we found that IFN induction does not affect the first round of reovirus replication but does prevent cell-cell spread in a paracrine fashion. Accordingly, during co-infections, T3DPL continues to replicate robustly despite activation of IFN by T3DTD. Using gene expression analysis, we discovered that reovirus can also induce a subset of genes in a RIG-I and IFN-independent manner; these genes were induced more by T3DPL than T3DTD. Polymorphisms in reovirus σ3 viral protein were found to control activation of RIG-I/ IFN-independent genes. Altogether, the study reveals that single amino acid polymorphisms in reovirus genomes can have large impact on host gene expression, by both changing replication kinetics and by modifying viral protein activity, such that two closely related T3D strains can induce opposite cytokine landscapes.


Conflict of interest statement

The authors have declared that no competing interests exist.

Figures

Fig 1
Fig 1. T3DTD activates interferon signalling more than T3DPL.
(A) Overview of IFN production (left) and response (right) antiviral signalling pathways. (B-G) L929 cells were infected with T3DPL or T3DTD at indicated MOI and incubated at 37°C for 12 or 24 hours. (B) Immunocytochemical staining with anti-reovirus polyclonal antiserum shows cells positive for reovirus protein expression at respective MOIs. (C) To monitor the rate of establishing infection, flow cytometric analysis using reovirus polyclonal antiserum shows the proportion of L929 cells positive for reovirus antigen expression at 12 versus 24hpi. Mock-infected controls confirm that the left quadrant are cells with limited-to-no reovirus antigen detection while right quadrant are cells sufficiently infected to produce detectable reovirus antigen levels. (D) Total proteins collected at 12hpi were separated using SDS PAGE and Western blot analysis with antibodies for reovirus proteins (σ3 and μ1), IRF3, or phosphor-IRF3. (E-F) At 12hpi, total RNA was extracted, converted to cDNA and gene expression relative to GAPDH was quantified by RT-qPCR. (E) Reovirus S4 and M2 reovirus RNAs, (F) type I IFNs Ifnb1 and Ifna4, (G) ISGs Rsad2 and Mx1. Reovirus gene values were normalized to T3D-TD MOI 1 whereas cellular gene values were normalized to MOCK. Each point represents a biological replicate from n = 3–4 independent experiments. Statistical analysis represents unpaired t-tests comparing T3DTD and T3DPL of matched MOI. **** p ≤ 0.0001, *** p ≤ 0.001, ** p ≤ 0.01, * p ≤ 0.05, ns > 0.05.
Fig 2
Fig 2. T3D-strain specific polymorphisms in S4, M1, and L3 genes affect IFN induction inversely to virus replication kinetics.
(A) Reovirus foci generated by parental and mono-reassortant T3DPL and T3DTD viruses on L929 cell line. Reovirus foci were stained with colorimetric immunocytochemistry using primary polyclonal reovirus antibody, alkaline phosphatase secondary antibody and BCIP/NBT substrate. Total particles were determined using OD260 of CsCl purified virus preparations (1OD260 = 2.1×10¹² particles /ml). Infectious particles were calculated using standard plaque assays on L929 cells. (B) L929 cells were exposed to T3DPL and T3DTD parental viruses, or S4-, M1-, or L3- mono-reassortants in otherwise PL- or TD- backgrounds at MOI 3. At 12hpi, total RNA was extracted, and RT-qPCR performed for Ifnb1 or Ifna4, each point represents a biological replicate from n = 3–4 independent experiments. One-way ANOVA with Dunnett's multiple comparisons test, **** p ≤ 0.0001, ns > 0.05. (C) Single-step virus growth analysis was conducted by measuring total titers over time. Each point represents the average of 2 technical replicates. (D) Relationship of total viral titres versus Ifnb1 gene expression (both at 12hpi) evaluated by linear regression analysis using PRISM; coefficient of determination (R2) is provided. Average Ifnb1 gene expression values obtained from Fig 2B.
Fig 3
Fig 3. Deceleration of reovirus replication causes higher IRF3 activation.
(A) Schematic of reovirus replication cycle with steps inhibited by cycloheximide (CHX) or guanidinium hydrochloride (GuHCl). (B-D) L929 cells were infected with T3DPL at MOI of 3 and treated with GuHCl or CHX through infection at indicated concentrations. At 12hpi, cells were subjected to (B) Western blot analysis for reovirus proteins and β-actin (Top) or dsRNA gel electrophoresis (Bottom). In independent experimental repeats, (C) cells were monitored by Western blot analysis for reovirus proteins and phosphor-IRF3, or (D) phosphor-IRF3, IRF3, and β-actin.
Fig 4
Fig 4. T3DTD is a potent inducer of IFN signalling that cannot be inhibited by T3DPL during co-infection.
(A, Left) L929 cells were co-infected with T3DPL and T3DTD, each at MOI 9. At 12hpi, total proteins were separated by SDS PAGE and Western blot analysis performed with antibodies for reovirus proteins (σ3 and μ1), IRF3, or phosphor-IRF3. (A, Right) Model proposed from data in (A) and tested in (B-H), that during T3DPL—T3DTD co-infections, T3DPL continues to replicate robustly while the slow-replicating T3DTD continues to induce IFN signalling. (B-D) L929 cells were infected with T3DPL and T3DTD separately, or co-infected with both T3D strains, at MOIs indicated. Cells were first exposed to virus at 4°C to allow binding but not internalization, washed three times, and either (B) lysed for detection of cell-bound virions, or (C-D) transferred to 37°C for infection. (B) Cell-associated virions were visualized by Western blot analysis for reovirus proteins (σ3 and μ1), and demonstrated equivalent levels between T3DPL and T3DTD at matched MOIs. (C) Flow cytometric analysis with reovirus polyclonal antiserum at 12hpi and 24hpi showed the delayed infection by T3DTD but that full infection of all cells was achieved at high MOI; this was to confirm that co-infection will occur at these MOIs when cells are exposed to both T3D strains. (D) Western blot analysis for reovirus proteins (σ3 and μ1), IRF3, or phosphor-IRF3 levels at 8hpi for individually (left) or co-infected (right) cells at indicated MOIs. (E-F) Western blot analysis (E) and RT-qPCR (F) show that during co-infection, high levels of reovirus protein and S4 RNAs phenodominate and resemble levels of T3DPL–infected cells. Each point represents a biological replicate n = 8. (G) To determine if during co-infection, high viral protein and RNA levels were attributed to T3DPL and/or T3DTD replication, RT-qPCR was conducted with S4 HRM-specific primers and HRM analysis performed. Each plot represents two replicates each of cells exposed to the virus(es) indicated at MOI of 75 or 150. (H) qPCR and HRM was performed on cDNA from T3DTD- infected cells, T3DPL-infected cells, or mixtures of these two cDNAs in ratios back-calculated to produce the indicated percent of total RNA representing S4 polymorphisms from T3DTD. The percentages were back-calculated from the RT-PCR levels obtained for T3DTD-only versus T3DPL-only samples. (I) The peak melting temperature from (H) plotted against the percent of S4 cDNA derived from T3DTD.
Fig 5
Fig 5. IFN signalling minimally restricts the first round of reovirus replication.
(A) WT or RIG-I/MDA5 -/- double knockout (DKO) MEFs were infected with T3DPL or T3DTD at MOI 6 for 12hpi. Total RNA was extracted, converted to cDNA and gene expression relative to housekeeping gene GAPDH was quantified using RT-qPCR for the genes indicated. All values were normalized to MOCK WT MEF. Each point represents a technical replicate for 1 (Ifna4) or 2 (Rsad2) independent experiments. (B) WT or DKO (RIG-I/MDA5 -/-) MEFs were infected with T3DPL or T3DTD. At indicated MOIs and timepoints, percent of cells expressing reovirus proteins was determined by flow cytometry with polyclonal anti-reovirus antibodies and flow cytometry. Each point represents an independent experiment, n = 1–3 depending on MOI. (C) Same as (A) but RT-qPCR was conducted for reovirus S4 RNA levels, n = 2. All values were normalized to WT MEF T3DTD. (D) WT or RIG-I/MDA5 -/- double knockout (DKO) MEFs were infected with T3DPL or T3DTD at MOI 1. (Left) Immunofluorescence staining at 18hpi confirms ~30% of cells are positive for reovirus antigen in all conditions. Reovirus specific primary antibody and Alexa Fluor 488 conjugated secondary antibody used to detect reovirus infected cells (Magenta), and HOESCHT 33342 to detect nuclei (Blue). (Right) Titres were determined by standard plaque assay on L929 cells for input, and progeny virus at 18 and 48hpi. (E) WT or DKO MEFs were infected with T3DPL or T3DTD under an agar overlay for 3 days. Reovirus infected cell foci were stained with colorimetric immunocytochemistry using primary polyclonal reovirus antibody, alkaline phosphatase secondary antibody and BCIP/NBT substrate. (F-I) NIH/3T3 cells stably transduced with scrambled (shSCR) or RIG-I (shRIG) lentivirus were mock-infected or infected with reovirus at MOIs of 20 and 60 (relative to titers obtained on the more-susceptible L929 cells), and incubated at 37°C. (F) At 12hpi, RNA from cells infected at MOI of 20 was extracted and subjected to cDNA synthesis and RT-qPCR for mouse RIG-I (Rig-i) and mouse GAPDH. RIG-I mRNA levels were corrected for GAPDH and presented relative to shSCR T3DPL (set to 1.0). Each point represents a biological replicate n = 2. (G and H) Similar to (F) but RT-qPCR was conducted for (G) IFNs or (H) ISGs indicated above each plot, and following infection at MOIs of both 20 and 60 as indicated. Each point represents a biological replicate n = 2. (I) At 12hpi, samples were subjected to Western Blot analysis for RIG-I, reovirus μ1 and σ3, or β acting loading control. (J) Similar to (G) but RT-qPCR was conducted for viral genes indicated above each plot, and following infection at MOIs of both 20 and 60 as indicated. Each point represents a biological replicate n = 2. (K) At 12 and 24hpi, cells underwent immunofluorescence staining with reovirus specific primary antibody and Alexa Fluor 488 conjugated secondary antibody to detect reovirus infected cells (Green), and HOESCHT 33342 to detect nuclei (Blue). Green staining represents reovirus infected cells, and blue staining represents cell nuclei.
Fig 6
Fig 6. Reovirus also induces RIG-I/IFN-independent genes.
(A) Density plot shows overall number of genes up and down regulated in whole genome microarray analysis conducted on NIH3T3 cells treated with Reovirus versus mock infected. (B) Experimental approach for (C-D): Whole genome microarray analysis was conducted for reovirus-infected NIH3T3 cells stably transduced by lentivirus expressing small hairpin RNAs to silence IFN receptor (shIFNAR), RIG-I (shRIG-I), retrovirus that overexpresses mouse RIG-I (mRIG-I O/E), or negative control shRNAs against green fluorescence protein. The diagram shows the comparison groups and parameters used for subsequent analysis in (C). (C) Venn diagram of all 2947 genes upregulated by reovirus in (A), grouped into whether they were downregulated by IFNAR silencing (yellow), downregulated by RIG-I silencing (blue), or upregulated by RIG-I over-expression (green), or unaffected by RIG-I and IFNAR modulation (purple). Each group and overlap in the Venn Diagram was then assigned a letter (A-F) to reflect that group. (D) Diagram shows where groups A-F fit within signalling pathways that produce IFNs (yellow) versus IFN-independent (purple) genes. (E) Whole genome microarray analysis was conduced for reovirus infected versus mock infected L929 cells and B16-F10 cells. The table summarizes the number of genes in groups A-F that were also upregulated by 2-fold in L929 and B16-F10 cells, as well as those shared by all three cell lines. (F) Tables show the genes in key groups used for subsequent analysis (A, B, F and H) shared among NIH3T3, L929 and B16-F10 cells. For group H, only the top 10 genes are listed due to space constraints. Complete lists of all genes in each group are provided in S1 Table.
Fig 7
Fig 7. RIG-I/IFN-independent genes are induced by differentially by T3D strains.
(A-B) L929 cells were treated with 1/10 dilutions (initial 1000 U/ml/12well) of purified IFNα or IFNβ for 12 hours at 37°C. Samples were collected for RNA extraction, cDNA synthesis and RT-PCR using gene-specific primers (corrected for GAPDH) for (A) ISGs or (B) genes proposed to be IFN-independent from Cluster 6 of Fig 6. Values were standardized to untreated sample. Each point represents a biological replicate n = 3. One-way ANOVA with Dunnett's multiple comparisons test, **** p ≤ 0.0001, *** p ≤ 0.001, ** p ≤ 0.01, * p ≤ 0.05. (C) NIH/3T3 cells stably transduced with scrambled (shSCR) or RIG-I (shRIG) lentivirus were mock-infected or infected with reovirus at MOIs of 20 and 60 (relative to titers obtained on the more-susceptible L929 cells), and incubated at 37°C. At 12hpi, RNA from cells infected at MOI of 20 was extracted and subjected to cDNA synthesis and RT-qPCR for Cxcl2, Csf2, Fas and mouse GAPDH. RIG-I mRNA levels were corrected for GAPDH and presented relative to shSCR T3DPL (set to 1.0). Each point represents a biological replicate n = 2. (D) RT-qPCR shows levels of indicated genes following infection of L929 cells with T3DPL or T3DTD at MOI 1, 3, or 9. For each gene, levels are standardized to MOCK, which is set to 1. Each point represents a biological replicate n = 3–4. Statistical analysis represents unpaired t-tests comparing T3DTD and T3DPL of similar MOI. **** p ≤ 0.0001, *** p ≤ 0.001, ** p ≤ 0.01, * p ≤ 0.05.
Fig 8
Fig 8. T3DPL S4-encoded σ3 stimulates expression of RIG-I/IFN-independent cytokines.
Standardized for equal infection (MOI 3), L929 cells were infected for 12hrs with parental T3DPL or T3DTD, and S4, M1 and L3 gene mono-reassortant TD-RG viruses. Total RNA was assessed for specified genes relative to housekeeping gene GAPDH. n = 3–4. Statistical significance determined using one-way ANOVA with Dunnett's multiple comparisons test, **** p ≤ 0.0001, *** p ≤ 0.001, ** p ≤ 0.01, * p ≤ 0.05.
Fig 9
Fig 9. Model: T3DPL versus T3DTD induce opposite expression of RIG/IFN-dependent versus independent gene expression; attributed to slow replication versus polymorphisms in σ3 respectively.
Previous studies described in text found that despite only 5 key polymorphisms, T3D strains had inherent differences in replication kinetics and in vivo oncolytic activities; with T3DTD being less oncolytic and slower replicating than T3DPL. In this manuscript, we discover that (Left) T3DTD, by virtue of slow replication kinetics, triggers more RIG-I-dependent IFN signalling relative to T3DPL. (Right) T3DPL, by virtue of rapid replication, avoids triggering of IFN producing and response pathways. Conversely, the polymorphisms in σ3 of T3DPL, lead to strong activation of RIG-I/IFN-independent genes. In the model, we depict a possible explanation for why T3DPL triggers less RIG-I/IFN signalling; by establishing sufficient segregation in virus factories (dotted line around replication complex), T3DPL overcomes PAMP detection and IFN signalling induction. Moreover, the results show that IFN does not impede T3D replication through autocrine antiviral action (i.e. ISG induction is not the reason for slow replication of T3DTD). However, antiviral signalling can further prevent dissemination of reovirus and could thereby contribute to reduced oncolytic activity of T3DTD. Finally, the model depicts that differential cytokine landscapes induced by distinct T3D strains could further contribute to differences in oncolytic activities in immunocompetent hosts; this new concept beacons further analysis on the effects of virus genomes on their immunotherapeutic potential.

Similar articles

Cited by

References

    1. Pichlmair A, Reis e Sousa C. Innate recognition of viruses. Immunity. 2007;27(3):370–83. 10.1016/j.immuni.2007.08.012 . - DOI - PubMed
    1. Jensen S, Thomsen AR. Sensing of RNA viruses: a review of innate immune receptors involved in recognizing RNA virus invasion. J Virol. 2012;86(6):2900–10. 10.1128/JVI.05738-11 - DOI - PMC - PubMed
    1. Chen S, Wu Z, Wang M, Cheng A. Innate Immune Evasion Mediated by Flaviviridae Non-Structural Proteins. Viruses. 2017;9(10). 10.3390/v9100291 - DOI - PMC - PubMed
    1. Lei X, Xiao X, Wang J. Innate Immunity Evasion by Enteroviruses: Insights into Virus-Host Interaction. Viruses. 2016;8(1). 10.3390/v8010022 - DOI - PMC - PubMed
    1. Rothenburg S, Brennan G. Species-Specific Host-Virus Interactions: Implications for Viral Host Range and Virulence. Trends Microbiol. 2020;28(1):46–56. 10.1016/j.tim.2019.08.007 - DOI - PMC - PubMed

Publication types

MeSH terms

Grants and funding