

Galectin-Glycan Interactions: Guidelines for Monitoring by 77 Se NMR Spectroscopy, and Solvent (H2 O/D2 O) Impact on Binding
- PMID: 32955737
- PMCID: PMC7839768
- DOI: 10.1002/chem.202003143
Galectin-Glycan Interactions: Guidelines for Monitoring by 77 Se NMR Spectroscopy, and Solvent (H2 O/D2 O) Impact on Binding
Abstract
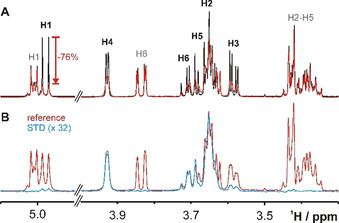
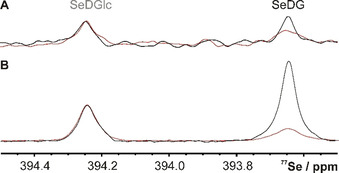
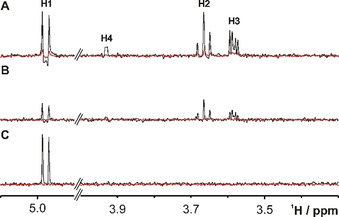
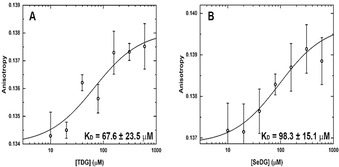
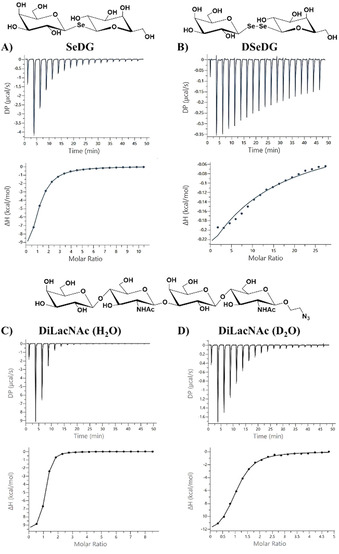
Functional pairing between cellular glycoconjugates and tissue lectins like galectins has wide (patho)physiological significance. Their study is facilitated by nonhydrolysable derivatives of the natural O-glycans, such as S- and Se-glycosides. The latter enable extensive analyses by specific 77 Se NMR spectroscopy, but still remain underexplored. By using the example of selenodigalactoside (SeDG) and the human galectin-1 and -3, we have evaluated diverse 77 Se NMR detection methods and propose selective 1 H,77 Se heteronuclear Hartmann-Hahn transfer for efficient use in competitive NMR screening against a selenoglycoside spy ligand. By fluorescence anisotropy, circular dichroism, and isothermal titration calorimetry (ITC), we show that the affinity and thermodynamics of SeDG binding by galectins are similar to thiodigalactoside (TDG) and N-acetyllactosamine (LacNAc), confirming that Se substitution has no major impact. ITC data in D2 O versus H2 O are similar for TDG and LacNAc binding by both galectins, but a solvent effect, indicating solvent rearrangement at the binding site, is hinted at for SeDG and clearly observed for LacNAc dimers with extended chain length.
Keywords: 77Se NMR spectroscopy; calorimetry; circular dichroism; galectins; selenoglycosides.
© 2020 The Authors. Chemistry - A European Journal published by Wiley-VCH GmbH.
Conflict of interest statement
The authors declare no conflict of interests.
Figures
Similar articles
-
77Se-Enriched Selenoglycoside Enables Significant Enhancement in NMR Spectroscopic Monitoring of Glycan-Protein Interactions.Pharmaceutics. 2022 Jan 15;14(1):201. doi: 10.3390/pharmaceutics14010201. Pharmaceutics. 2022. PMID: 35057096 Free PMC article.
-
Selenoglycosides as Lectin Ligands: 77 Se-Edited CPMG-HSQMBC NMR Spectroscopy To Monitor Biomedically Relevant Interactions.Chembiochem. 2019 Jul 1;20(13):1688-1692. doi: 10.1002/cbic.201900088. Epub 2019 Jun 5. Chembiochem. 2019. PMID: 30828921 Free PMC article.
-
Introducing 77Se NMR Spectroscopy to Analyzing Galectin -Ligand Interaction.Methods Mol Biol. 2022;2442:105-123. doi: 10.1007/978-1-0716-2055-7_6. Methods Mol Biol. 2022. PMID: 35320522
-
Key regulators of galectin-glycan interactions.Proteomics. 2016 Dec;16(24):3111-3125. doi: 10.1002/pmic.201600116. Proteomics. 2016. PMID: 27582340 Free PMC article. Review.
-
Assembly, organization and regulation of cell-surface receptors by lectin-glycan complexes.Biochem J. 2015 Jul 1;469(1):1-16. doi: 10.1042/BJ20150461. Biochem J. 2015. PMID: 26173257 Review.
Cited by
-
Glycan Shape, Motions, and Interactions Explored by NMR Spectroscopy.JACS Au. 2024 Jan 3;4(1):20-39. doi: 10.1021/jacsau.3c00639. eCollection 2024 Jan 22. JACS Au. 2024. PMID: 38274261 Free PMC article. Review.
-
77Se-Enriched Selenoglycoside Enables Significant Enhancement in NMR Spectroscopic Monitoring of Glycan-Protein Interactions.Pharmaceutics. 2022 Jan 15;14(1):201. doi: 10.3390/pharmaceutics14010201. Pharmaceutics. 2022. PMID: 35057096 Free PMC article.
-
Investigation of the Molecular Details of the Interactions of Selenoglycosides and Human Galectin-3.Int J Mol Sci. 2022 Feb 24;23(5):2494. doi: 10.3390/ijms23052494. Int J Mol Sci. 2022. PMID: 35269646 Free PMC article.
-
Exploring multivalent carbohydrate-protein interactions by NMR.Chem Soc Rev. 2023 Mar 6;52(5):1591-1613. doi: 10.1039/d2cs00983h. Chem Soc Rev. 2023. PMID: 36753338 Free PMC article. Review.
-
Saturation Transfer Difference NMR and Molecular Docking Interaction Study of Aralkyl-Thiodigalactosides as Potential Inhibitors of the Human-Galectin-3 Protein.Int J Mol Sci. 2024 Feb 1;25(3):1742. doi: 10.3390/ijms25031742. Int J Mol Sci. 2024. PMID: 38339036 Free PMC article.
References
-
- None
-
- Winterburn P. J., Phelps C. F., Nature 1972, 236, 147–151; - PubMed
-
- The Sugar Code: Fundamentals of Glycosciences (Ed.: Gabius H.-J.), Wiley-VCH, Weinheim, 2009;
MeSH terms
Substances
Grants and funding
LinkOut - more resources
Full Text Sources
Research Materials
