An atlas of immune cell exhaustion in HIV-infected individuals revealed by single-cell transcriptomics
- PMID: 32954948
- PMCID: PMC7646563
- DOI: 10.1080/22221751.2020.1826361
An atlas of immune cell exhaustion in HIV-infected individuals revealed by single-cell transcriptomics
Abstract
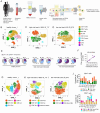
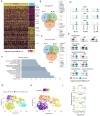
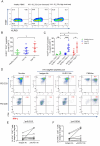
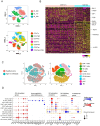
Chronic infection with human immunodeficiency virus (HIV) can cause progressive loss of immune cell function, or exhaustion, which impairs control of virus replication. However, little is known about the development and maintenance, as well as heterogeneity of immune cell exhaustion. Here, we investigated the effects of HIV infection on immune cell exhaustion at the transcriptomic level by analyzing single-cell RNA sequencing of peripheral blood mononuclear cells from four healthy subjects (37,847 cells) and six HIV-infected donors (28,610 cells). We identified nine immune cell clusters and eight T cell subclusters, and three of these (exhausted CD4+ and CD8+ T cells and interferon-responsive CD8+ T cells) were detected only in samples from HIV-infected donors. An inhibitory receptor KLRG1 was identified in a HIV-1 specific exhausted CD8+ T cell population expressing KLRG1, TIGIT, and T-betdimEomeshi markers. Ex-vivo antibody blockade of KLRG1 restored the function of HIV-specific exhausted CD8+ T cells demonstrating the contribution of KLRG1+ population to T cell exhaustion and providing an immunotherapy target to treat HIV chronic infection. These data provide a comprehensive analysis of gene signatures associated with immune cell exhaustion during HIV infection, which could be useful in understanding exhaustion mechanisms and developing new cure therapies.
Keywords: HIV-1; KLRG1; NK cell impairment; T cell dysfunction; immune exhaustion; single-cell RNA-seq.
Conflict of interest statement
T.M.R. is a founder of ViRx Pharmaceuticals and has an equity interest in the company. The terms of this arrangement have been reviewed and approved by the University of California San Diego in accordance with its conflict of interest policies.
Figures


Similar articles
-
Delayed Expression of PD-1 and TIGIT on HIV-Specific CD8 T Cells in Untreated HLA-B*57:01 Individuals Followed from Early Infection.J Virol. 2020 Jul 1;94(14):e02128-19. doi: 10.1128/JVI.02128-19. Print 2020 Jul 1. J Virol. 2020. PMID: 32350076 Free PMC article. Clinical Trial.
-
KLRG1-expressing CD8+ T cells are exhausted and polyfunctional in patients with chronic hepatitis B.PLoS One. 2024 May 22;19(5):e0303945. doi: 10.1371/journal.pone.0303945. eCollection 2024. PLoS One. 2024. PMID: 38776335 Free PMC article.
-
Increased KLRG1 and PD-1 expression on CD8 T lymphocytes in TB-IRIS.PLoS One. 2019 Apr 25;14(4):e0215991. doi: 10.1371/journal.pone.0215991. eCollection 2019. PLoS One. 2019. PMID: 31022273 Free PMC article.
-
T-bet and Eomes are differentially linked to the exhausted phenotype of CD8+ T cells in HIV infection.PLoS Pathog. 2014 Jul 17;10(7):e1004251. doi: 10.1371/journal.ppat.1004251. eCollection 2014 Jul. PLoS Pathog. 2014. PMID: 25032686 Free PMC article. Clinical Trial.
-
T-cell exhaustion in HIV infection.Immunol Rev. 2019 Nov;292(1):149-163. doi: 10.1111/imr.12823. Immunol Rev. 2019. PMID: 31883174 Free PMC article. Review.
Cited by
-
Single Cell Metabolomics: A Future Tool to Unmask Cellular Heterogeneity and Virus-Host Interaction in Context of Emerging Viral Diseases.Front Microbiol. 2020 Jun 3;11:1152. doi: 10.3389/fmicb.2020.01152. eCollection 2020. Front Microbiol. 2020. PMID: 32582094 Free PMC article. Review.
-
Immune mobilising T cell receptors redirect polyclonal CD8+ T cells in chronic HIV infection to form immunological synapses.Sci Rep. 2022 Nov 1;12(1):18366. doi: 10.1038/s41598-022-23228-3. Sci Rep. 2022. PMID: 36319836 Free PMC article.
-
Delving deeper into the mechanisms fundamental to HIV-associated immunopathology using single-cell sequencing techniques: A scoping review of current literature.Heliyon. 2024 Aug 6;10(16):e35856. doi: 10.1016/j.heliyon.2024.e35856. eCollection 2024 Aug 30. Heliyon. 2024. PMID: 39224354 Free PMC article.
-
Machine learning approaches identify immunologic signatures of total and intact HIV DNA during long-term antiretroviral therapy.Elife. 2024 Sep 9;13:RP94899. doi: 10.7554/eLife.94899. Elife. 2024. PMID: 39250423 Free PMC article.
-
HIV Infection Elicits Differential Transcriptomic Remodeling in CD4+ T Cells with Variable Proliferative Responses to the T Cell Receptor Stimulus.Pathogens. 2023 Mar 24;12(4):511. doi: 10.3390/pathogens12040511. Pathogens. 2023. PMID: 37111397 Free PMC article.
References
MeSH terms
Substances
Grants and funding
LinkOut - more resources
Full Text Sources
Other Literature Sources
Medical
Molecular Biology Databases
Research Materials
