Prognostic implications of metabolism-associated gene signatures in colorectal cancer
- PMID: 32953273
- PMCID: PMC7474523
- DOI: 10.7717/peerj.9847
Prognostic implications of metabolism-associated gene signatures in colorectal cancer
Abstract
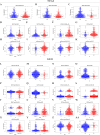
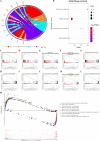
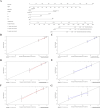
Colorectal cancer (CRC) is one of the most common and deadly malignancies. Novel biomarkers for the diagnosis and prognosis of this disease must be identified. Besides, metabolism plays an essential role in the occurrence and development of CRC. This article aims to identify some critical prognosis-related metabolic genes (PRMGs) and construct a prognosis model of CRC patients for clinical use. We obtained the expression profiles of CRC from The Cancer Genome Atlas database (TCGA), then identified differentially expressed PRMGs by R and Perl software. Hub genes were filtered out by univariate Cox analysis and least absolute shrinkage and selection operator Cox analysis. We used functional enrichment analysis methods, such as Gene Ontology, Kyoto Encyclopedia of Genes and Genomes, and Gene Set Enrichment Analysis, to identify involved signaling pathways of PRMGs. The nomogram predicted overall survival (OS). Calibration traces were used to evaluate the consistency between the actual and the predicted survival rate. Finally, a prognostic model was constructed based on six metabolic genes (NAT2, XDH, GPX3, AKR1C4, SPHK1, and ADCY5), and the risk score was an independent prognostic prognosticator. Genetic expression and risk score were significantly correlated with clinicopathologic characteristics of CRC. A nomogram based on the clinicopathological feature of CRC and risk score accurately predicted the OS of individual CRC cancer patients. We also validated the results in the independent colorectal cancer cohorts GSE39582 and GSE87211. Our study demonstrates that the risk score is an independent prognostic biomarker and is closely correlated with the malignant clinicopathological characteristics of CRC patients. We also determined some metabolic genes associated with the survival and clinical stage of CRC as potential biomarkers for CRC diagnosis and treatment.
Keywords: Bioinformatic analysis; Biomarker; Colorectal cancer; GEO; Metabolic gene; TCGA.
©2020 Miao et al.
Conflict of interest statement
The authors declare there are no competing interests.
Figures


Similar articles
-
Epigenetic and metabolic reprogramming in inflammatory bowel diseases: diagnostic and prognostic biomarkers in colorectal cancer.Cancer Cell Int. 2023 Nov 7;23(1):264. doi: 10.1186/s12935-023-03117-z. Cancer Cell Int. 2023. PMID: 37936149 Free PMC article. Review.
-
Construction and validation of an RNA-binding protein-associated prognostic model for colorectal cancer.PeerJ. 2021 Apr 5;9:e11219. doi: 10.7717/peerj.11219. eCollection 2021. PeerJ. 2021. PMID: 33868829 Free PMC article.
-
Circular RNA-Associated Competing Endogenous RNA Network and Prognostic Nomogram for Patients With Colorectal Cancer.Front Oncol. 2019 Nov 8;9:1181. doi: 10.3389/fonc.2019.01181. eCollection 2019. Front Oncol. 2019. PMID: 31781492 Free PMC article.
-
Single-Cell RNA Sequencing Reveals the Role of Epithelial Cell Marker Genes in Predicting the Prognosis of Colorectal Cancer Patients.Dis Markers. 2022 Aug 1;2022:8347125. doi: 10.1155/2022/8347125. eCollection 2022. Dis Markers. 2022. PMID: 35968507 Free PMC article.
-
Overexpression of AMPD2 indicates poor prognosis in colorectal cancer patients via the Notch3 signaling pathway.World J Clin Cases. 2020 Aug 6;8(15):3197-3208. doi: 10.12998/wjcc.v8.i15.3197. World J Clin Cases. 2020. PMID: 32874974 Free PMC article. Review.
Cited by
-
Derivation and Clinical Validation of a Redox-Driven Prognostic Signature for Colorectal Cancer.Front Oncol. 2021 Oct 27;11:743703. doi: 10.3389/fonc.2021.743703. eCollection 2021. Front Oncol. 2021. PMID: 34778061 Free PMC article.
-
Epigenetic and metabolic reprogramming in inflammatory bowel diseases: diagnostic and prognostic biomarkers in colorectal cancer.Cancer Cell Int. 2023 Nov 7;23(1):264. doi: 10.1186/s12935-023-03117-z. Cancer Cell Int. 2023. PMID: 37936149 Free PMC article. Review.
-
Construction and validation of an RNA-binding protein-associated prognostic model for colorectal cancer.PeerJ. 2021 Apr 5;9:e11219. doi: 10.7717/peerj.11219. eCollection 2021. PeerJ. 2021. PMID: 33868829 Free PMC article.
-
Construction and Validation of a Protein-associated Prognostic Model for Gastrointestinal Cancer.Comb Chem High Throughput Screen. 2023;26(1):191-206. doi: 10.2174/1386207325666220414105743. Comb Chem High Throughput Screen. 2023. PMID: 35430986
-
Construction of a Prognostic Model Based on Cuproptosis-Related lncRNA Signatures in Pancreatic Cancer.Can J Gastroenterol Hepatol. 2022 Nov 11;2022:4661929. doi: 10.1155/2022/4661929. eCollection 2022. Can J Gastroenterol Hepatol. 2022. PMID: 36406148 Free PMC article.
References
-
- Arif T, Krelin Y, Nakdimon I, Benharroch D, Paul A, Dadon-Klein D, Shoshan-Barmatz V. VDAC1 is a molecular target in glioblastoma, with its depletion leading to reprogrammed metabolism and reversed oncogenic properties. Neuro Oncology. 2017;19:951–964. doi: 10.1093/neuonc/now297. - DOI - PMC - PubMed
-
- Bensard CL, Wisidagama DR, Olson KA, Berg JA, Krah NM, Schell JC, Nowinski SM, Fogarty S, Bott AJ, Wei P, Dove KK, Tanner JM, Panic V, Cluntun A, Lettlova S, Earl CS, Namnath DF, Vazquez-Arreguin K, Villanueva CJ, Tantin D, Murtaugh LC, Evason KJ, Ducker GS, Thummel CS, Rutter J. Regulation of tumor initiation by the mitochondrial pyruvate carrier. Cell Metabolism. 2020;31:284–300. doi: 10.1016/j.cmet.2019.11.002. - DOI - PMC - PubMed
-
- Christopher J. Global, regional, and national disability-adjusted life-years (DALYs) for 359 diseases and injuries and healthy life expectancy (HALE) for 195 countries and territories, 1990–2017: a systematic analysis for the Global Burden of Disease Study 2017. Lancet. 2018;392:1859–1922. doi: 10.1016/s0140-6736(18)32335-3. - DOI - PMC - PubMed
Grants and funding
LinkOut - more resources
Full Text Sources
Miscellaneous

