Chemerin enhances the adhesion and migration of human endothelial progenitor cells and increases lipid accumulation in mice with atherosclerosis
- PMID: 32951592
- PMCID: PMC7504628
- DOI: 10.1186/s12944-020-01378-5
Chemerin enhances the adhesion and migration of human endothelial progenitor cells and increases lipid accumulation in mice with atherosclerosis
Abstract
Background: The role of adipokines in the development of atherosclerosis (AS) has received increasing attention in recent years. This study aimed to explore the effects of chemerin on the functions of human endothelial progenitor cells (EPCs) and to investigate its role in lipid accumulation in ApoE-knockout (ApoE-/-) mice.
Methods: EPCs were cultured and treated with chemerin together with the specific p38 mitogen-activated protein kinase (MAPK) inhibitor SB 203580 in a time- and dose-dependent manner. Changes in migration, adhesion, proliferation and the apoptosis rate of EPCs were detected. ApoE-/- mice with high-fat diet-induced AS were treated with chemerin with or without SB 203580. Weights were recorded, lipid indicators were detected, and tissues sections were stained.
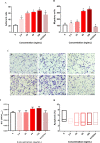
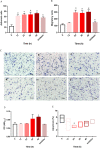
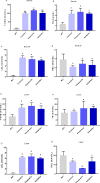
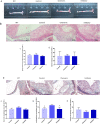
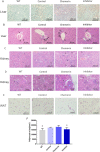
Results: The data showed that chemerin enhanced the adhesion and migration abilities of EPCs, and reduced the apoptosis ratio and that this effect might be mediated through the p38 MAPK pathway. Additionally, chemerin increased the instability of plaques. Compared with the control group and the inhibitor group, ApoE-/- mice treated with chemerin protein had more serious arterial stenosis, higher lipid contents in plaques and decreased collagen. Lipid accumulation in the liver and kidney and inflammation in the hepatic portal area were enhanced by treatment with chemerin, and the size of adipocytes also increased after chemerin treatment. In conclusion, chemerin can enhance the adhesion and migration abilities of human EPCs and reduce the apoptosis ratio. In animals, chemerin can increase lipid accumulation in atherosclerotic plaques and exacerbate plaques instability. At the same time, chemerin can cause abnormal lipid accumulation in the livers and kidneys of model animals. After specifically blocking the p38 MAPK pathway, the effect of chemerin was reduced.
Conclusions: In conclusion, this study showed that chemerin enhances the adhesion and migration abilities of EPCs and increases the instability of plaques and abnormal lipid accumulation in ApoE-/- mice. Furthermore, these effects might be mediated through the p38 MAPK pathway.
Keywords: Adipokines; Atherosclerosis; Chemerin; Endothelial progenitor cells (EPCs); Inflammation; Lipid metabolism; MAPK pathway; Plaque.
Conflict of interest statement
The authors declare that they have no competing interests.
Figures

Similar articles
-
Inhibition of p38 Mitogen-Activated Protein Kinase Enhances the Apoptosis Induced by Oxidized Low-Density Lipoprotein in Endothelial Progenitor Cells.J Vasc Res. 2015;52(6):361-71. doi: 10.1159/000443889. Epub 2016 Apr 1. J Vasc Res. 2015. PMID: 27031525
-
Adipokine Chemerin Stimulates Progression of Atherosclerosis in ApoE-/- Mice.Biomed Res Int. 2019 Oct 31;2019:7157865. doi: 10.1155/2019/7157865. eCollection 2019. Biomed Res Int. 2019. PMID: 31781638 Free PMC article.
-
Importance of β2AR elevation for re-endothelialization capacity mediated by late endothelial progenitor cells in hypertensive patients.Am J Physiol Heart Circ Physiol. 2021 Feb 1;320(2):H867-H880. doi: 10.1152/ajpheart.00596.2020. Epub 2020 Dec 24. Am J Physiol Heart Circ Physiol. 2021. PMID: 33356961
-
The role of monocytosis and neutrophilia in atherosclerosis.J Cell Mol Med. 2018 Mar;22(3):1366-1382. doi: 10.1111/jcmm.13462. Epub 2018 Jan 24. J Cell Mol Med. 2018. PMID: 29364567 Free PMC article. Review.
-
Chemerin in atherosclerosis.Clin Chim Acta. 2021 Sep;520:8-15. doi: 10.1016/j.cca.2021.05.015. Epub 2021 May 20. Clin Chim Acta. 2021. PMID: 34022243 Review.
Cited by
-
Hsa-miR-409-3p regulates endothelial progenitor senescence via PP2A-P38 and is a potential ageing marker in humans.J Cell Mol Med. 2023 Mar;27(5):687-700. doi: 10.1111/jcmm.17691. Epub 2023 Feb 9. J Cell Mol Med. 2023. PMID: 36756741 Free PMC article.
-
Circulating chemerin levels in metabolic-associated fatty liver disease: a systematic review and meta-analysis.Lipids Health Dis. 2022 Mar 2;21(1):27. doi: 10.1186/s12944-022-01637-7. Lipids Health Dis. 2022. PMID: 35236351 Free PMC article. Review.
-
AGEs/RAGE Promote Osteogenic Differentiation in Rat Bone Marrow-Derived Endothelial Progenitor Cells via MAPK Signaling.J Diabetes Res. 2022 Feb 1;2022:4067812. doi: 10.1155/2022/4067812. eCollection 2022. J Diabetes Res. 2022. PMID: 35155684 Free PMC article.
-
Role of Chemerin in Cardiovascular Diseases.Biomedicines. 2022 Nov 18;10(11):2970. doi: 10.3390/biomedicines10112970. Biomedicines. 2022. PMID: 36428537 Free PMC article. Review.
-
Hepatocyte expressed chemerin-156 does not protect from experimental non-alcoholic steatohepatitis.Mol Cell Biochem. 2022 Aug;477(8):2059-2071. doi: 10.1007/s11010-022-04430-3. Epub 2022 Apr 21. Mol Cell Biochem. 2022. PMID: 35449483 Free PMC article.
References
-
- Hoogeveen RM, Nahrendorf M, Riksen NP, Netea MG, de Winther M, Lutgens E, Nordestgaard BG, Neidhart M, Stroes E, Catapano AL, Bekkering S. Monocyte and haematopoietic progenitor reprogramming as common mechanism underlying chronic inflammatory and cardiovascular diseases. Eur Heart J. 2018;39:3521–3527. doi: 10.1093/eurheartj/ehx581. - DOI - PMC - PubMed
MeSH terms
Substances
Grants and funding
LinkOut - more resources
Full Text Sources
Medical
Molecular Biology Databases
Research Materials
Miscellaneous

