. 2020 Oct;46(4):1321-1334.
doi: 10.3892/ijmm.2020.4692. Epub 2020 Aug 3.

Effects of NRP1 on angiogenesis and vascular maturity in endothelial cells are dependent on the expression of SEMA4D

Affiliations

Effects of NRP1 on angiogenesis and vascular maturity in endothelial cells are dependent on the expression of SEMA4D

Zhi Lyu et al. Int J Mol Med. 2020 Oct.

Abstract

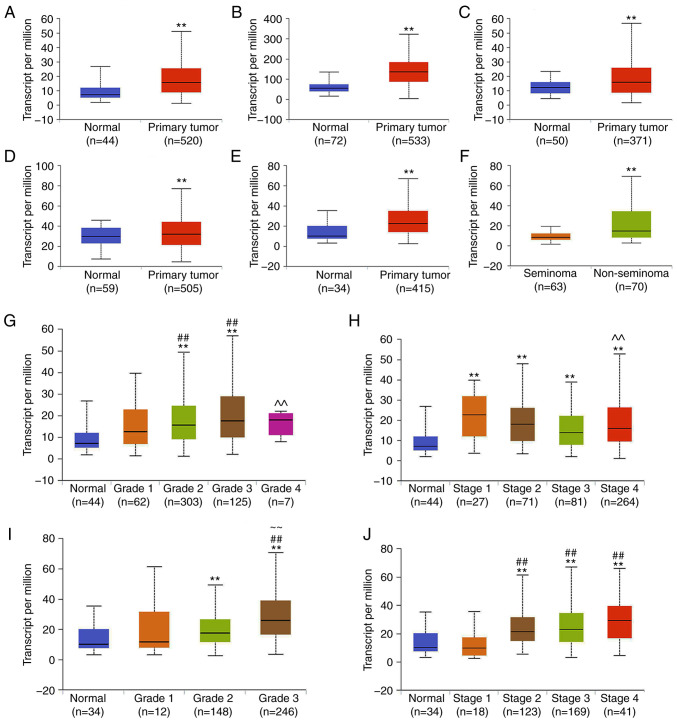
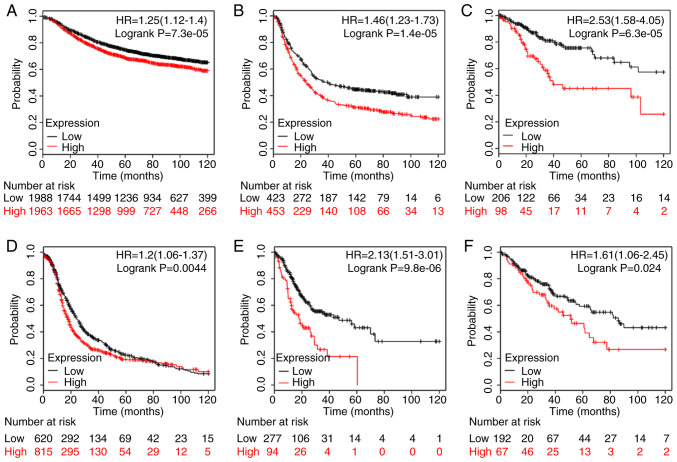
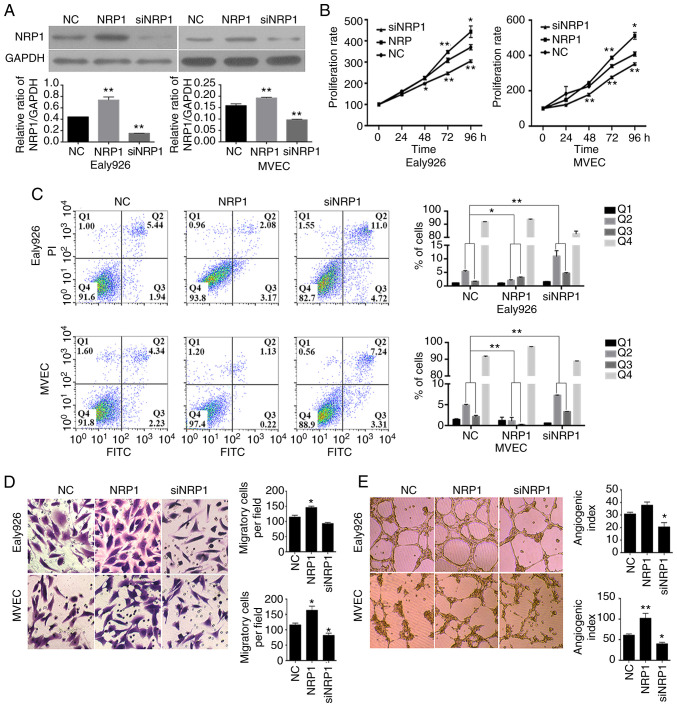
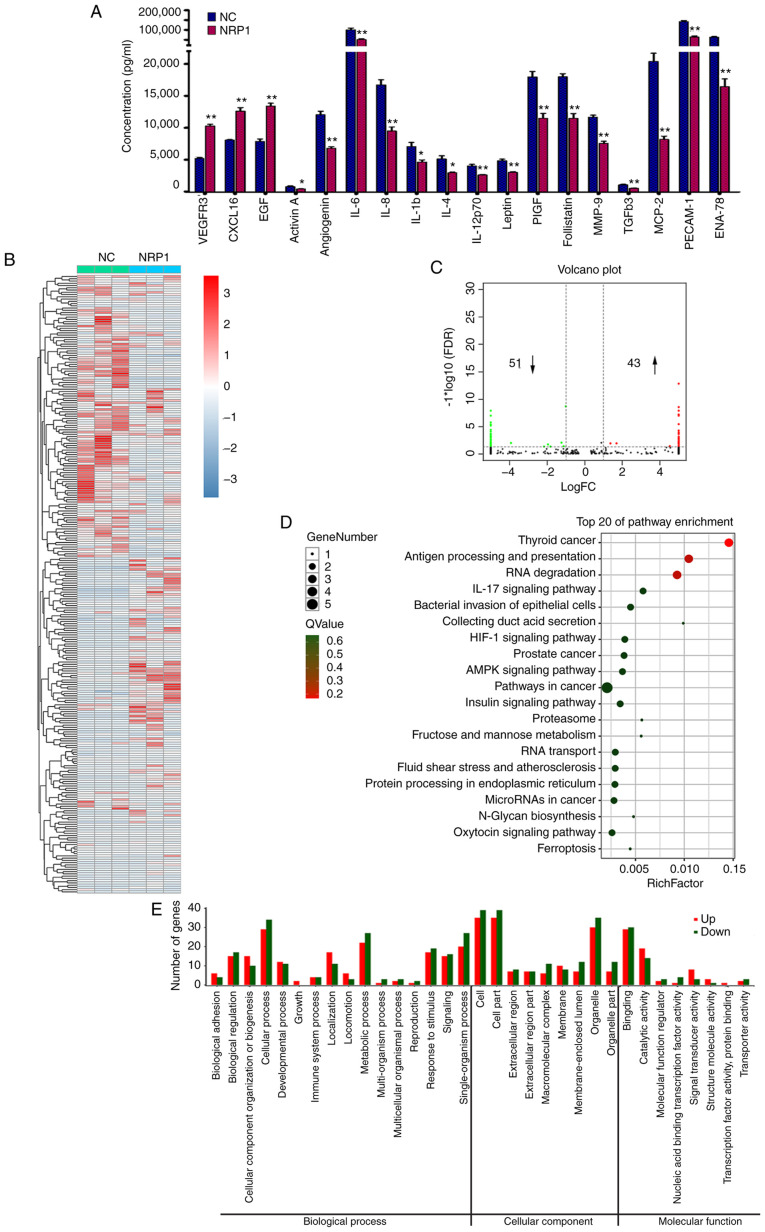
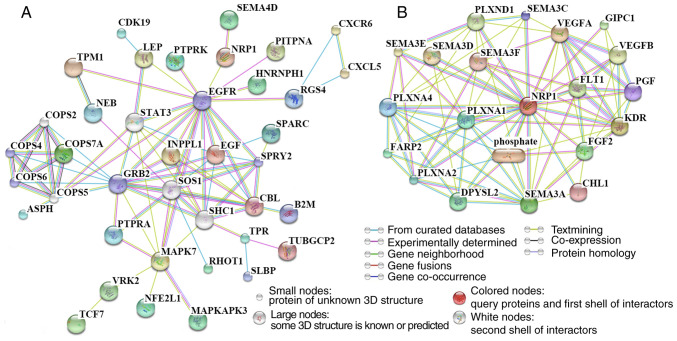
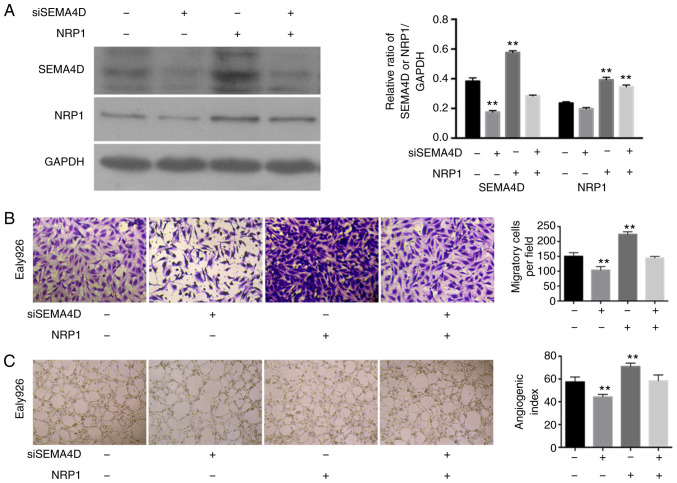
Angiogenesis and vascular maturation play important roles in tumorigenesis and tumor development. The expression of neuropilin 1 (NRP1) is closely associated with angiogenesis in tumors; however, the molecular mechanisms of action in angiogenesis and tumor maturation, as well as the potential clinical value of NRP1 remain unclear. The importance of NRP1 expression in tumor progression was determined using The Cancer Genome Atlas (TCGA) database analysis. Gain‑ and loss‑of‑function experiments of NRP1 were performed in vascular endothelial cells (ECs) to investigate the functions in angiogenesis. CCK‑8, flow cytometry, Transwell experiments and a series of in vitro experiments were used to detect cell functions. A combination of angiogenesis antibody arrays and RNA‑Seq analyses were performed to reveal the proangiogenic mechanisms of action. The function of semaphorin 4D (SEMA4D) was also investigated separately. NRP1 mRNA levels were significantly increased in primary tumors compared with normal tissues based on TCGA data (P<0.01) and were associated with tumor development in patients. Gain‑ and loss‑of‑function experiments highlighted the function of NRP1 in promoting EC proliferation, motility and capillary‑like tube formation and in reducing apoptosis. NRP1 overexpression led to significantly decreased EC markers (PECAM‑1, angiogenin, PIGF and MMP‑9) expression levels and reduced the vascular maturity. MAPK7, TPM1, RRBP1, PTPRK, HSP90A, PRKD2, PFKFB3, RGS4 and SPARC were revealed to play important roles in this process. SEMA4D was revealed to be a key protein associated with NRP1 in ECs. These data indicated that NRP1‑promoted angiogenesis may be induced at the cost of reducing maturity of the ECs. NRP1 may also be a therapeutic target for antiangiogenic strategies and a candidate prognostic marker for tumors.


Figures

Figure 1
Figure 1
Expression of NRP1 in tumors using the UALCAN database analysis. Expression of NRP1 in (A) HNSC, (B) KIRC, (C) LIHC, (D) THCA and (E) STAD samples based on sample types of normal and primary tumor TCGA samples. (F) Expression of NRP1 in TGCTs based on tumor histology of seminoma and non-seminoma TCGA samples. Expression of NRP1 in HNSC based on the (G) tumor grade and (H) individual cancer stages in TCGA samples. Expression of NRP1 in STAD samples based on the (I) tumor grade and (J) individual cancer stages in TCGA samples. Grade 1, well differentiated (low grade); grade 2, moderately differentiated (intermediate grade); grade 3, poorly differentiated (high grade); grade 4, undifferentiated (high grade). **P<0.01 vs. Normal; ##P<0.01 vs. Grade 1 or Stage 1; ~~P<0.01 vs. Grade 2 or Stage 2; ^^P<0.01 vs. Grade 3 or Stage 3. NRP1, neuropilin 1; HNSC, head and neck squamous cell carcinoma; KIRC, kidney renal clear cell carcinoma; LIHC, liver hepatocellular carcinoma; THCA, thyroid carcinoma; STAD, stomach adenocarcinoma; TCGA, The Cancer Genome Atlas; TGCT, testicular germ cell tumor.
Figure 2
Figure 2
Prognostic significance of NRP1 expression in various tumor types of patients with (A) breast cancer (n=3951), (B) gastric cancer (n=876), (C) cervical squamous cell carcinoma (n=304), (D) ovarian cancer (n=1435), (E) stomach adenocarcinoma (n=371), and (F) sarcoma (n=259). The analysis was carried using the Kaplan-Meier plotter database (http://kmplot.com/analysis/). Using the Kaplan-Meier plots, hazard ratios with 95% confidence intervals and log-rank P-values were calculated. NRP1, neuropilin 1.
Figure 3
Figure 3
In vitro assays of NRP1 functions in the Ealy926 and MVEC cell lines with overexpression or knockdown of NRP1. (A) Efficient NRP1 overexpression or knockdown was confirmed using western blotting. GAPDH was used as the loading control. (B) Proliferative rates of Ealy926 and MVEC cell lines with overexpression or knockdown of NRP1, detected using CCK-8 assays. (C) Apoptosis assays with Ealy926 and MVEC cell lines after NRP1 overexpres-sion and knockdown as determined using flow cytometry. (D) Migration (×200) and (E) in vitro tube-forming activity (×40) of Ealy926 and MVEC cells after overexpression or knockdown of NRP1. The number of cells or tubes were counted in five randomly selected fields. NC represents the control group and NRP1 represents the NRP1 overexpression group. *P<0.05 and **P<0.01 vs. NC. NRP1, neuropilin 1; siNRP1, siRNA knockdown of the NRP1 group; CCK-8, Cell Counting Kit-8.
Figure 4
Figure 4
Analysis of potential mechanisms of action involved in the proangiogenic activity of NRP1 in HUVECs. (A) The various expression levels of angio-genesis-related proteins in the control (NC) and NRP1-overexpression (NRP1) HUVEC groups were detected using the RayBiotech Human Angiogenesis Antibody Array C Series 1000 kit. (B) The heatmap plot of RNA-Seq results of HUVEC cells in the control (NC) and NRP1-overexpression (NRP1) groups. (C) The Volcano plot of RNA-Seq results. (D) Top 20 KEGG pathways enriched in the DEGs identified by RNA-Seq. (E) Comparison of GO terms of DEGs identified by RNA-Seq in HUVECs. Proteins with band densities exhibiting a fold increase of >1.5 or a fold decrease of <0.67 were defined as differentially expressed. DEGs of RNA-Seq were identified with two criteria: i) An FDR of <0.05 and a |log2fold change| of >1. NC represents the control group and NRP1 represents the NRP1 overexpression group. *P<0.05 and **P<0.01. NRP1, neuropilin 1; HUVEC, human umbilical vein endothelial cells; KEGG, Kyoto Encyclopedia of Genes and Genomes; DEG, differentially expressed gene; GO, Gene Ontology; FDR, false discovery rate.
Figure 5
Figure 5
Signaling pathways related to the angiogenic function of NRP1 as determined using the STITCH website. (A) Pathway analysis of differentially expressed proteins detected using the human angiogenesis antibody array and DEGs from RNA-Seq. The maximum number of interactors for the 1st shell and 2nd shells were set as no more than 5 and the score of predicted functional partners was >0.999. (B) The top 20 proteins which were most closely related to NRP1. The maximum number of interactors for the 1st shell was no more than 20 interactors and the score of predicted functional partners was >0.935. The minimum required interaction score was a medium confidence of 0.400. NRP1, neuropilin 1; DEG, differentially expressed gene; GRB2, growth factor receptor-bound protein 2; EGFR, epidermal growth factor receptor; COPS6, COP9 constitutive photomorphogenic homolog subunit 6; SPRY2, sprout homolog 2; COPS4, COP9 constitutive photomorphogenic homolog subunit 4; VEGFA, vascular endothelial growth factor A; KDR, kinase insert domain receptor; FLT1, fms-related tyrosine kinase 1; SEMA3A, semaphorin 3A; PLXNA1, plexin A1, coreceptor for SEMA3A, SEMA3C, SEMA3F and SEMA6D; PLXNA2, plexin A2, coreceptor for SEMA3A and SEMA6A; PLXNA4, plexin A4, coreceptor for SEMA3A; SEMA3C, semaphorin 3C; PGF, placental growth factor; CHL1, close homolog of L1; SEMA3F, semaphorin 3F; phosphate, phosphoric acid; SEMA3D, semaphorin 3D; SEMA3E, semaphorin 3E; VEGFB, vascular endothelial growth factor B; PLXND1, plexin D1, cell surface receptor for SEMA4A and for class 3 semaphorins; GIPC1, GIPC PDZ domain-containing family, member 1; FGF2, fibroblast growth factor 2; DPYSL2, dihydropyrimidinase-like 2; FARP2, FERM, RhoGEF and pleckstrin domain protein 2.
Figure 6
Figure 6
SEMA4D mediates the angiogenic function of NRP1 in the Ealy926 cell line. (A) Western blotting for the protein levels of NRP1 and SEMA4D in Ealy926 cell line treated with control, SEMA4D knockdown, NRP1 overexpression and siSEMA4D + NRP1 overexpression. GAPDH was used as the loading control. (B) Migration activity of the Ealy926 cell line with control, SEMA4D knockdown, NRP1 overexpression and siSEMA4D + NRP1 overexpression (×200). (C) In vitro tube-forming activity of the Ealy926 cell line with control, SEMA4D knockdown, NRP1 overexpression and siSEMA4D + NRP1 overexpression (×40). The number of cells or tubes were counted in five randomly selected fields. **P<0.01 vs. NC. NRP1, neuropilin 1; SEMA4D, semaphoring 4D; si, siRNA.

Similar articles

Cited by

References

    1. Moriya J, Minamino T. Angiogenesis, cancer, and vascular aging. Front Cardiovasc Med. 2017;4:65. doi: 10.3389/fcvm.2017.00065. - DOI - PMC - PubMed
    1. Gacche RN, Meshram RJ. Targeting tumor micro-environment for design and development of novel anti-angiogenic agents arresting tumor growth. Prog Biophys Mol Biol. 2013;113:333–354. doi: 10.1016/j.pbiomolbio.2013.10.001. - DOI - PubMed
    1. Sun X, Evren S, Nunes SS. Blood vessel maturation in health and disease and its implications for vascularization of engineered tissues. Crit Rev Biomed Eng. 2015;43:433–454. doi: 10.1615/CritRevBiomedEng.2016016063. - DOI - PubMed
    1. Jain RK. Normalization of tumor vasculature: An emerging concept in antiangiogenic therapy. Science. 2005;307:58–62. doi: 10.1126/science.1104819. - DOI - PubMed
    1. Goel S, Duda DG, Xu L, Munn LL, Boucher Y, Fukumura D, Jain RK. Normalization of the vasculature for treatment of cancer and other diseases. Physiol Rev. 2011;91:1071–1121. doi: 10.1152/physrev.00038.2010. - DOI - PMC - PubMed

MeSH terms