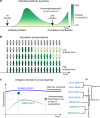
A systematic review of antibody mediated immunity to coronaviruses: kinetics, correlates of protection, and association with severity
- PMID: 32943637
- PMCID: PMC7499300
- DOI: 10.1038/s41467-020-18450-4
A systematic review of antibody mediated immunity to coronaviruses: kinetics, correlates of protection, and association with severity
Abstract
Many public health responses and modeled scenarios for COVID-19 outbreaks caused by SARS-CoV-2 assume that infection results in an immune response that protects individuals from future infections or illness for some amount of time. The presence or absence of protective immunity due to infection or vaccination (when available) will affect future transmission and illness severity. Here, we review the scientific literature on antibody immunity to coronaviruses, including SARS-CoV-2 as well as the related SARS-CoV, MERS-CoV and endemic human coronaviruses (HCoVs). We reviewed 2,452 abstracts and identified 491 manuscripts relevant to 5 areas of focus: 1) antibody kinetics, 2) correlates of protection, 3) immunopathogenesis, 4) antigenic diversity and cross-reactivity, and 5) population seroprevalence. While further studies of SARS-CoV-2 are necessary to determine immune responses, evidence from other coronaviruses can provide clues and guide future research.
Conflict of interest statement
The authors declare no competing interests.
Figures


Update of
-
A systematic review of antibody mediated immunity to coronaviruses: antibody kinetics, correlates of protection, and association of antibody responses with severity of disease.medRxiv [Preprint]. 2020 Apr 17:2020.04.14.20065771. doi: 10.1101/2020.04.14.20065771. medRxiv. 2020. Update in: Nat Commun. 2020 Sep 17;11(1):4704. doi: 10.1038/s41467-020-18450-4. PMID: 32511434 Free PMC article. Updated. Preprint.
Similar articles
-
A systematic review of antibody mediated immunity to coronaviruses: antibody kinetics, correlates of protection, and association of antibody responses with severity of disease.medRxiv [Preprint]. 2020 Apr 17:2020.04.14.20065771. doi: 10.1101/2020.04.14.20065771. medRxiv. 2020. Update in: Nat Commun. 2020 Sep 17;11(1):4704. doi: 10.1038/s41467-020-18450-4. PMID: 32511434 Free PMC article. Updated. Preprint.
-
Structures of Human Antibodies Bound to SARS-CoV-2 Spike Reveal Common Epitopes and Recurrent Features of Antibodies.Cell. 2020 Aug 20;182(4):828-842.e16. doi: 10.1016/j.cell.2020.06.025. Epub 2020 Jun 24. Cell. 2020. PMID: 32645326 Free PMC article.
-
The dynamics of humoral immune responses following SARS-CoV-2 infection and the potential for reinfection.J Gen Virol. 2020 Aug;101(8):791-797. doi: 10.1099/jgv.0.001439. J Gen Virol. 2020. PMID: 32430094 Free PMC article. Review.
-
Neutralizing Antibodies against SARS-CoV-2 and Other Human Coronaviruses.Trends Immunol. 2020 May;41(5):355-359. doi: 10.1016/j.it.2020.03.007. Epub 2020 Apr 2. Trends Immunol. 2020. PMID: 32249063 Free PMC article.
-
[Adaptive immunity against SARS-CoV-2].Med Sci (Paris). 2020 Oct;36(10):908-913. doi: 10.1051/medsci/2020168. Epub 2020 Sep 22. Med Sci (Paris). 2020. PMID: 32960167 Review. French.
Cited by
-
Broadly potent spike-specific human monoclonal antibodies inhibit SARS-CoV-2 Omicron sub-lineages.Commun Biol. 2024 Oct 2;7(1):1239. doi: 10.1038/s42003-024-06951-7. Commun Biol. 2024. PMID: 39354108 Free PMC article.
-
High transmission of endemic human coronaviruses before and during the COVID-19 pandemic in adolescents in Cebu, Philippines.BMC Infect Dis. 2024 Sep 27;24(1):1042. doi: 10.1186/s12879-024-09672-8. BMC Infect Dis. 2024. PMID: 39333882 Free PMC article.
-
Clonal landscape of autoantibody-secreting plasmablasts in COVID-19 patients.Life Sci Alliance. 2024 Sep 17;7(12):e202402774. doi: 10.26508/lsa.202402774. Print 2024 Dec. Life Sci Alliance. 2024. PMID: 39288992 Free PMC article.
-
Advancements and challenges in stem cell transplantation for regenerative medicine.Heliyon. 2024 Aug 10;10(16):e35836. doi: 10.1016/j.heliyon.2024.e35836. eCollection 2024 Aug 30. Heliyon. 2024. PMID: 39247380 Free PMC article. Review.
-
An immunoassay based on bioluminescent sensors for rapid detection of African swine fever virus antibodies.J Clin Microbiol. 2024 Oct 16;62(10):e0046324. doi: 10.1128/jcm.00463-24. Epub 2024 Sep 5. J Clin Microbiol. 2024. PMID: 39235247
References
-
- Godlee, F. The burning building. BMJ m1101, 10.1136/bmj.m1101 (2020).
Publication types
MeSH terms
Substances
Grants and funding
LinkOut - more resources
Full Text Sources
Other Literature Sources
Miscellaneous

