

As(V) and As(III) sequestration by starch functionalized magnetite nanoparticles: influence of the synthesis route onto the trapping efficiency
- PMID: 32939177
- PMCID: PMC7476536
- DOI: 10.1080/14686996.2020.1782714
As(V) and As(III) sequestration by starch functionalized magnetite nanoparticles: influence of the synthesis route onto the trapping efficiency
Abstract
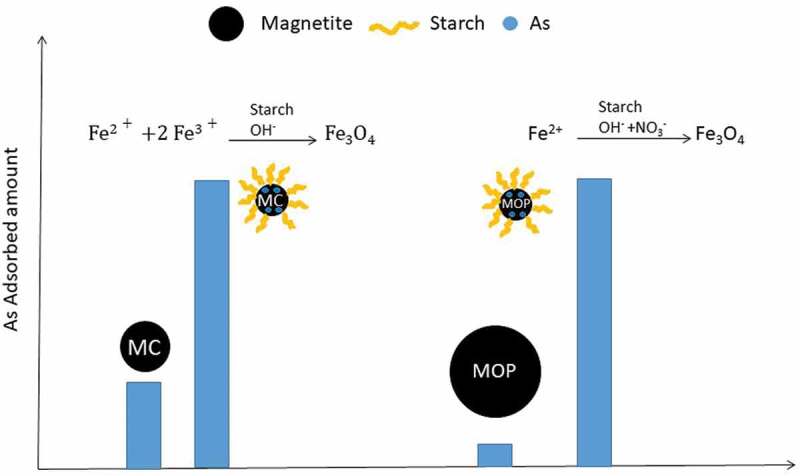
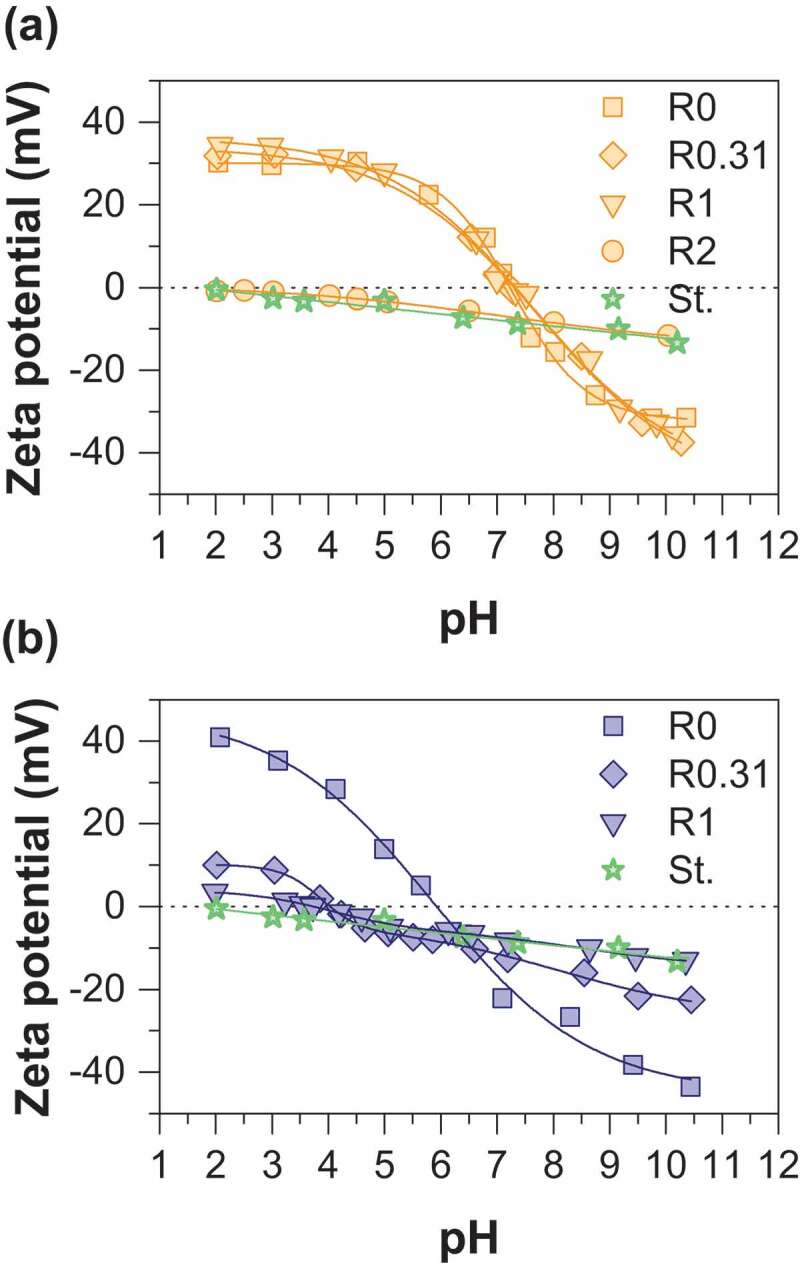
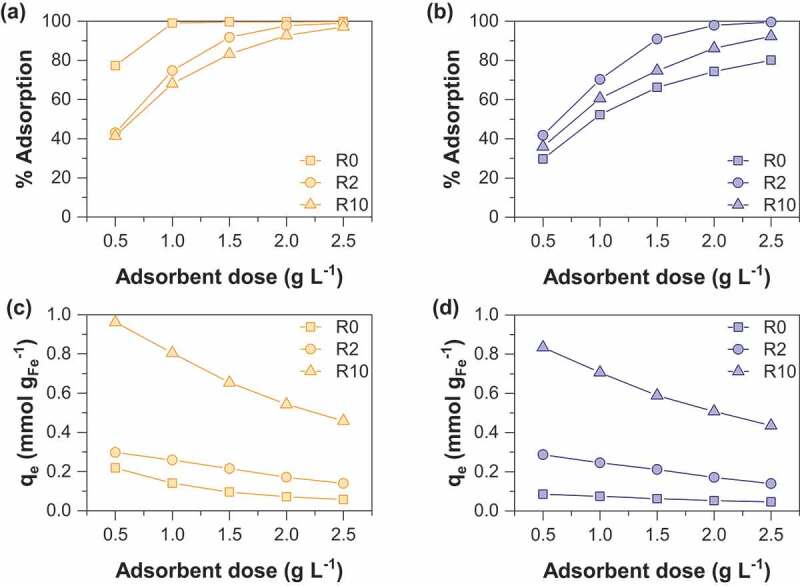
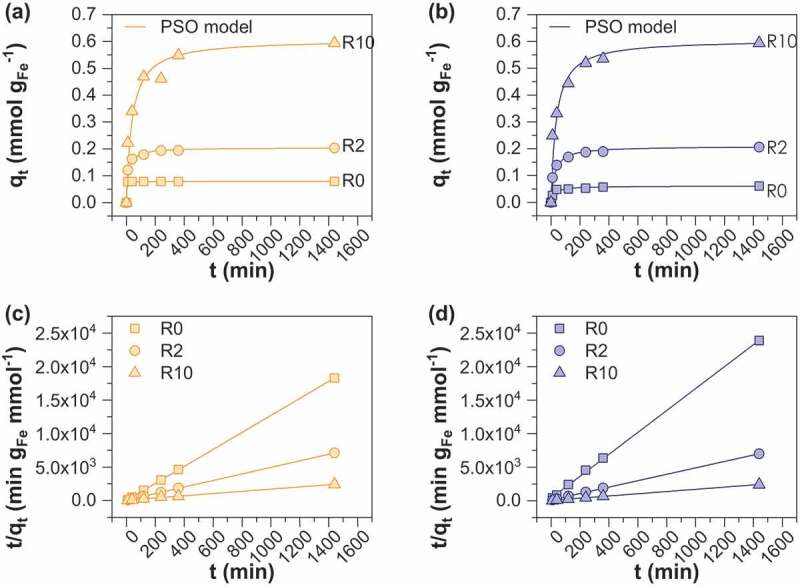
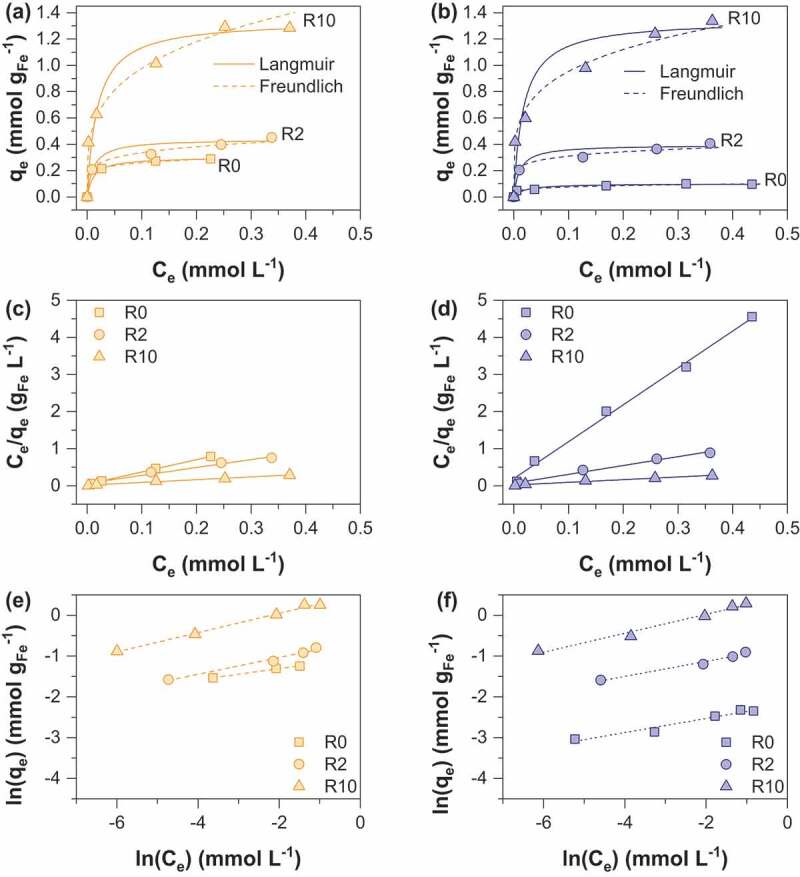
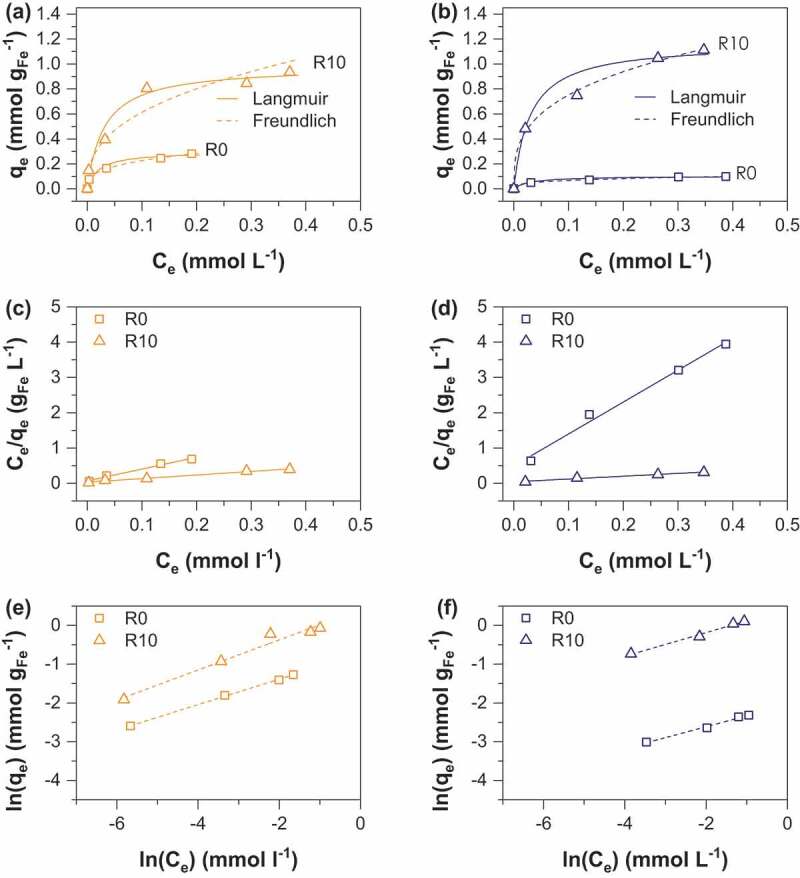
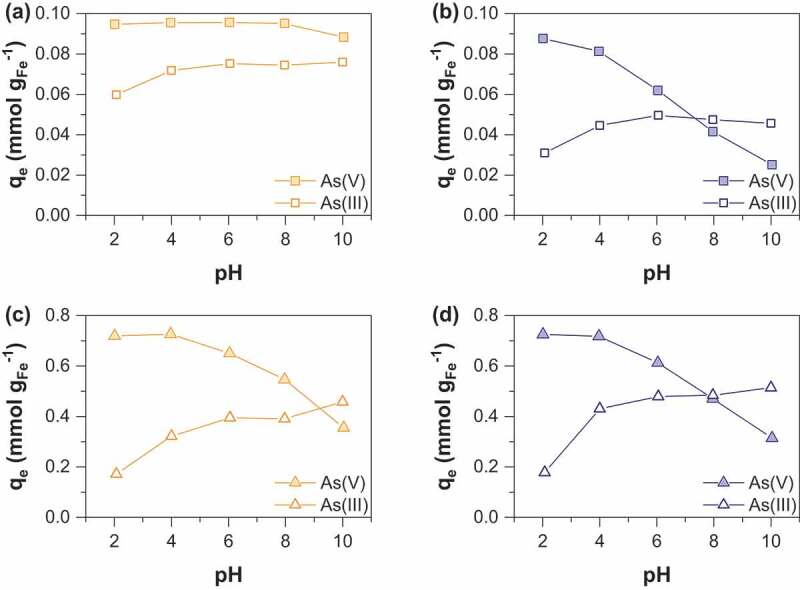
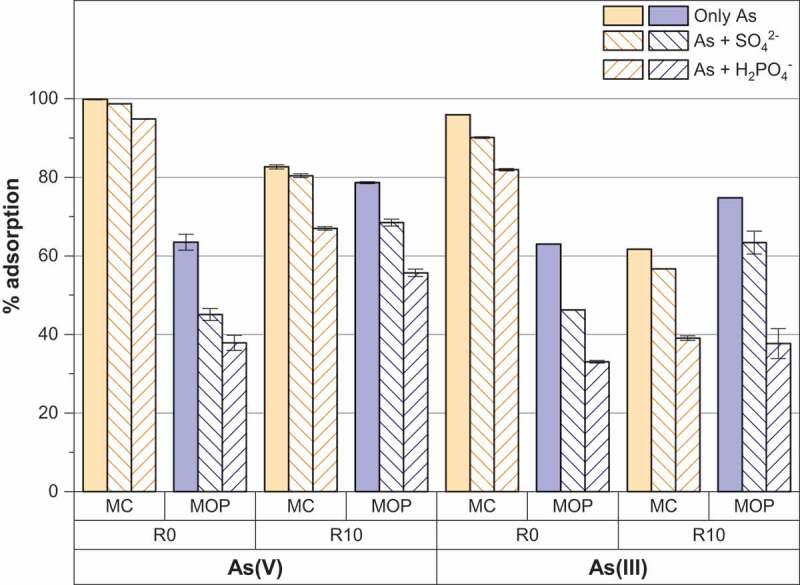
We report the effect of the synthesis route of starch-functionalized magnetite nanoparticles (NPs) on their adsorption properties of As(V) and As(III) from aqueous solutions. NP synthesis was achieved by two different routes implying the alkaline precipitation of either a mixed Fe2+/Fe3+ salt solution (MC samples) or a Fe2+ salt solution in oxidative conditions (MOP samples). Syntheses were carried out with starch to Fe mass ratio (R) ranging from 0 to 10. The crystallites of starch-free MC NPs (14 nm) are smaller than the corresponding MOP (67 nm), which leads to higher As(V) sorption capacity of 0.3 mmol gFe -1 to compare with respect to 0.1 mmol gFe -1 for MOP at pH = 6. MC and MOP starch-functionalized NPs exhibit higher sorption capacities than a pristine one and the difference in sorption capacities between MOP and MC samples decreases with increasing R values. Functionalization tends to reduce the size of the magnetite crystallites and to prevent their agglomeration. Size reduction is more pronounced for MOP samples (67 nm (R0) to 12 nm (R10)) than for MC samples (14 nm (R0) to 9 nm (R10)). Therefore, due to close crystallite size, both MC and MOP samples, when prepared at R = 10, display similar As(V) (respectively, As(III)) sorption capacities close to 1.3 mmol gFe -1 (respectively, 1.0 mmol gFe -1). Additionally, according to the effect of pH on arsenic trapping, the electrostatic interactions appear as a major factor controlling As(V) adsorption while surface complexation may control As(III) adsorption.
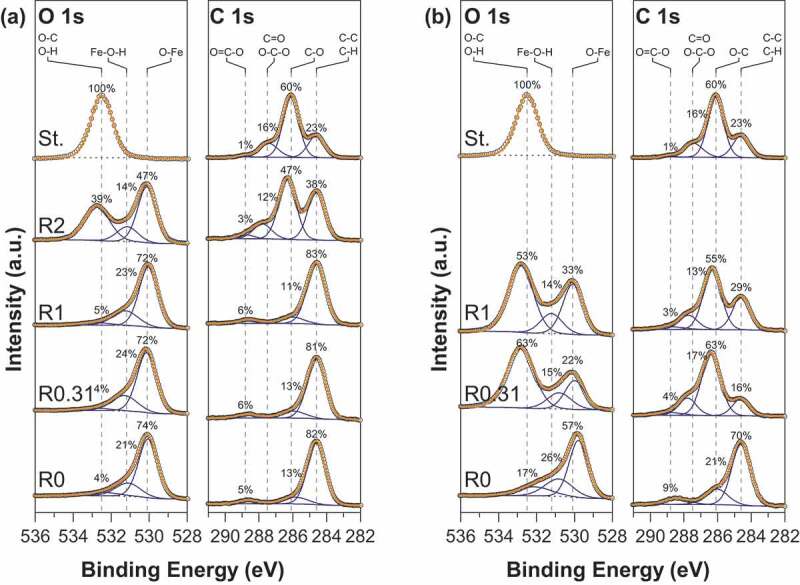
Keywords: 212 Surface and interfaces; 301 Chemical syntheses / processing; 308 Materials resources / recycling; 501 Chemical analyses; 502 Electron spectroscopy; Magnetite; XPS; arsenic; polysaccharide; sorption capacity; zeta potential.
© 2020 The Author(s). Published by National Institute for Materials Science in partnership with Taylor & Francis Group.
Conflict of interest statement
No potential conflict of interest was reported by the authors.
Figures
Similar articles
-
Distinctive arsenic(V) trapping modes by magnetite nanoparticles induced by different sorption processes.Environ Sci Technol. 2011 Sep 1;45(17):7258-66. doi: 10.1021/es200299f. Epub 2011 Aug 2. Environ Sci Technol. 2011. PMID: 21809819
-
Insight into the Mechanism of Arsenic(III/V) Uptake on Mesoporous Zerovalent Iron-Magnetite Nanocomposites: Adsorption and Microscopic Studies.ACS Appl Mater Interfaces. 2020 Nov 4;12(44):49755-49767. doi: 10.1021/acsami.0c14088. Epub 2020 Oct 21. ACS Appl Mater Interfaces. 2020. PMID: 33084324
-
EXAFS and HRTEM evidence for As(III)-containing surface precipitates on nanocrystalline magnetite: implications for As sequestration.Langmuir. 2009 Aug 18;25(16):9119-28. doi: 10.1021/la900655v. Langmuir. 2009. PMID: 19601563
-
Assessing South American Guadua chacoensis bamboo biochar and Fe3O4 nanoparticle dispersed analogues for aqueous arsenic(V) remediation.Sci Total Environ. 2020 Mar 1;706:135943. doi: 10.1016/j.scitotenv.2019.135943. Epub 2019 Dec 9. Sci Total Environ. 2020. PMID: 31862592
-
Natural attenuation of arsenic by sediment sorption and oxidation.Environ Sci Technol. 2009 Jun 15;43(12):4253-9. doi: 10.1021/es802841x. Environ Sci Technol. 2009. PMID: 19603631
Cited by
-
Bio-interactive nanoarchitectonics with two-dimensional materials and environments.Sci Technol Adv Mater. 2022 Mar 30;23(1):199-224. doi: 10.1080/14686996.2022.2054666. eCollection 2022. Sci Technol Adv Mater. 2022. PMID: 35370475 Free PMC article. Review.
-
Starch-Based Polymer Materials as Advanced Adsorbents for Sustainable Water Treatment: Current Status, Challenges, and Future Perspectives.Polymers (Basel). 2023 Jul 21;15(14):3114. doi: 10.3390/polym15143114. Polymers (Basel). 2023. PMID: 37514503 Free PMC article. Review.
References
-
- Choong TSY, Chuah TG, Robiah Y, et al. Arsenic toxicity, health hazards and removal techniques from water: an overview. Desalination. 2007;217:139–166.
-
- Bissen M, Frimmel FH. Arsenic—a review. Part II: oxidation of arsenic and its removal in water treatment. Acta Hydrochim Hydrobiol. 2003;31:97–107.
-
- M R A, M A H, Shenashen MA, et al. Evaluating of arsenic(V) removal from water by weak-base anion exchange adsorbents. Environ Sci Pollut Res. 2013;20:421–430. - PubMed
-
- Awual MR, Shenashen MA, Yaita T, et al. Efficient arsenic(V) removal from water by ligand exchange fibrous adsorbent. Water Res. 2012;46:5541–5550. - PubMed
LinkOut - more resources
Full Text Sources
Research Materials
Miscellaneous