. 2020 Sep 16;11(9):764.
doi: 10.1038/s41419-020-02930-y.

BCAT1 binds the RNA-binding protein ZNF423 to activate autophagy via the IRE1-XBP-1-RIDD axis in hypoxic PASMCs

Affiliations

BCAT1 binds the RNA-binding protein ZNF423 to activate autophagy via the IRE1-XBP-1-RIDD axis in hypoxic PASMCs

Wei Xin et al. Cell Death Dis. .

Erratum in

Abstract

Abnormal functional changes in pulmonary artery smooth muscle cells are the main causes of many lung diseases. Among, autophagy plays a crucial role. However, the specific molecular regulatory mechanism of autophagy in PASMCs remains unclear. Here, we first demonstrate that BCAT1 played a key role in the autophagy of hypoxic PASMCs and hypoxic model rats. BCAT1-induced activation and accumulation of the autophagy signaling proteins BECN1 and Atg5 by the endoplasmic reticulum (ER) stress pathway. Interestingly, we discovered that BCAT1 bound IRE1 on the ER to activate expression of its downstream pathway XBP-1-RIDD axis to activate autophagy. More importantly, we identified an RNA-binding protein, zinc finger protein 423, which promoted autophagy by binding adenylate/uridylate (AU)-rich elements in the BCAT1 mRNA 3'-untranslated region. Overall, our results identify BCAT1 as a potential therapeutic target for the clinical treatment of lung diseases and reveal a novel posttranscriptional regulatory mechanism and signaling pathway in hypoxia-induced PASMC autophagy.


Conflict of interest statement

The authors declare that they have no conflict of interest.

Figures
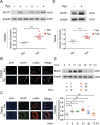
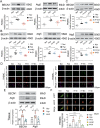
Fig. 1
Fig. 1. Hypoxia resultes in the increased expression of BCAT1.
a Western blot analysis of BCAT1 expression in hypoxic PASMCs (n = 8). b Subcellular distribution of BCAT1 in PASMCs determined by immunofluorescence analysis. Scale bars: 50 μm (n = 3). c The cellular expression of BCAT1 in the smooth muscle layer of lung tissues from hypoxic model rats determined by immunofluorescence staining analysis. Scale bar = 100 μm (n = 3). d BCAT1 protein levels in pulmonary arterial tissues of hypoxia model rats (n = 8). e Time course of BCAT1 expression of PASMCs at 0, 6, 12, 24, 48, and 72 h after hypoxia treatment (n = 6). Nor normoxia, Hyp hypoxia, Mct monocrotaline. Statistical analysis was performed with one-way ANOVA or the Student’s t test. All values are presented as the mean ± SEM. *p < 0.05; **p < 0.01; ***p < 0.001; ns not significant.
Fig. 2
Fig. 2. Upregulation of BCAT1 expression induced by hypoxia leads to PASMC autophagy.
a Western blot analysis of BECN1 and Atg5 protein expression in PASMCs treated with the inhibitor gabapentin (20 µM) (n = 8). b Western blot analysis of BECN1 and Atg5 protein expression in PASMCs transfected with BCAT1 siRNA or BCAT1 plasmid (n = 8). c, d Immunofluorescence staining for BECN1 and Atg5 in PASMCs. BECN1 and Atg5 (green), α-SMA (red), and DAPI (blue). Scale bar = 50 μm (n = 3). e Western blot analysis of BECN1 and Atg5 expression in the pulmonary arterial tissues of hypoxia model rats treated with gabapentin (n = 7). f Measurement of autophagic flux in PASMCs transfected with eGFP-mRFP-LC3 plasmid and exposed under NOR or HYP for 24 h treated with BCAT1 siRNA or the BCAT1 inhibitor gabapentin. Yellow and red dots indicate autolysosomes and autophagosomes, respectively. Scale bar = 50 μm (n = 6). Nor normoxia, Hyp hypoxia, Mct monocrotaline, H + G hypoxia plus gabapentin, M + G monocrotaline plus gabapentin, H + NC hypoxia plus control siRNA, H + SI hypoxia plus BCAT1 siRNA, H + Con hypoxia plus control vector, H + B hypoxia plus BCAT1 plasmid. Statistical analysis was performed with one-way ANOVA. All values are presented as the mean ± SEM. *p < 0.05; **p < 0.01; ***p < 0.001.
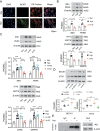
Fig. 3
Fig. 3. BCAT1 regulates autophagy through the endoplasmic reticulum stress pathway.
a Expression of BCAT1 and ER-Tracker Red staining in PASMCs exposed to NOR or HYP for 24 h. Scale bar = 50 μm (n = 3). b Western blot analysis of PERK, IRE1, ATF6, and GRP78 protein expression in the ERs pathway in PASMCs treated with gabapentin (n = 8). c Western blot analysis of IRE1, PERK, ATF6, and GRP78 expression in PASMCs transfected with BCAT1 siRNA (n = 8). d Western blot analysis of BECN1 and Atg5 in PASMCs treated with the ERs pathway inhibitor 4-PBA and BCAT1 plasmid (n = 8). e Coimmunoprecipitation of the whole-cell lysates of PASMCs exposed to normoxia or hypoxia for 24 h with anti-IRE1, followed by probing with anti-BCAT1 (n = 3). Nor normoxia, Hyp hypoxia, H + G hypoxia plus gabapentin, H + NC hypoxia plus control siRNA, H + SI hypoxia plus BCAT1 siRNA, N + Con normoxia plus control vector, H + Con hypoxia plus control vector, H + B hypoxia plus BCAT1 plasmid, H + Con+4 hypoxia plus control vector plus 4-phenylbutyric acid, H + B + 4 hypoxia plus BCAT1 plasmid plus 4-phenylbutyric acid, IP immunoprecipitation, IB immunoblotting. Statistical analysis was performed with one-way ANOVA. All values are presented as the mean ± SEM. **p < 0.01; ***p < 0.001.
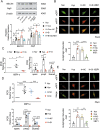
Fig. 4
Fig. 4. BCAT1 regulates autophagy during hypoxia by activating ERs via the IRE1-XBP1-RIDD axis.
a Western blot analysis of BECN1 and Atg5 in PASMCs cotransfected with BCAT1 and IRE1 siRNA (n = 5). b Autophagic flux was monitored in PASMCs cotransfected with eGFP-mRFP-LC3 plasmid and control siRNA or IRE1 siRNA that were then exposed to HYP for 24 h. Scale bar = 50 μm (n = 3). c, d RT-PCR analysis of the mRNA levels of XBP1-s, sparc, pmp2, and Scara3 with rat β-actin serving as the standard (n = 5). e The formation of autophagosomes was detected, and autophagic activity was estimated in cells in which the expression of XBP1 was knocked down with XBP1 siRNA under HYP for 24 h. Scale bar = 50 µm (n = 5). Nor normoxia, Hyp hypoxia, H + G hypoxia plus gabapentin, H + NC hypoxia plus control siRNA, H + SI hypoxia plus BCAT1 siRNA, H + SI-IRE1 hypoxia plus IRE1 siRNA, H + SI-XBP1 hypoxia plus XBP1 siRNA, H + Con hypoxia plus control vector, H + B hypoxia plus BCAT1 plasmid, H + Con+NC hypoxia plus control vector plus control siRNA, H + B + Si-IRE hypoxia plus BCAT1 plasmid plus IRE1 siRNA. Statistical analysis was performed with one-way ANOVA. All values are presented as the mean ± SEM. *p < 0.05; **p < 0.01; ***p < 0.001.
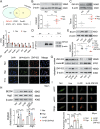
Fig. 5
Fig. 5. Hypoxia leads to the transfer of ZNF423 from the nucleus to the cytoplasm, where it bound BCAT1 to promote autophagy activity.
a Bioinformatics analysis of proteins associated with BCAT1. Upside: According to the JASPAR database and LASAGNA-Search 2.0 database, there was 28 genes that may bind to bcat1, and the binding ability of ZNF423, STAT1, Pou5f1, STAT3, SP1, SOX9, and TEAD1 was strong. Underside: RT-PCR analysis of the mRNA levels of ZNF423, STAT1, Pou5f1, STAT3, SP1, SOX9, and TEAD1 with rat β-actin serving as the standard in PASMCs under NOR or HYP for 24 h (n = 5). b Western blot analysis of the expression of ZNF423 in PASMCs under NOR or HYP for 24 h (n = 6). c ZNF423 protein levels were assayed in pulmonary arterial tissues of hypoxic model rats (n = 4). d Coimmunoprecipitation of whole-cell lysates of PASMCs exposed to normoxia or hypoxia for 24 h with anti-ZNF423, followed by probing with anti-BCAT1 (n = 3). e Western blot analysis of BCAT1 expression in PASMCs transfected with ZNF423 siRNA under NOR or HYP for 24 h (n = 4). f PASMCs were exposed to HYP for 24 h, and the colocalization between BCAT1 and ZNF423 was determined by immunofluorescence. GFP-BCAT1 (green), ZNF423 (red), and DAPI (blue). Scale bar = 50 μm (n = 3). g The translocation of ZNF423 between the nucleus and cytoplasm in PASMCs transfected with BCAT1 siRNA or gabapentin (n = 3). h Western blot analysis of the expression of BECN1 and Atg5 in PASMCs transfected with ZNF423 siRNA under HYP for 24 h (n = 4). i Autophagic flux of PASMCs cotransfected with eGFP-mRFP-LC3 plasmid and control siRNA or ZNF423 siRNA under HYP for 24 h. Scale bar = 50 μm (n = 5). Nor normoxia, Hyp hypoxia, H + G hypoxia plus gabapentin, H + NC hypoxia plus control siRNA, H + SI hypoxia plus BCAT1 siRNA, H + si-ZNF423 hypoxia plus ZNF423 siRNA, IP immunoprecipitation, IB immunoblotting. Statistical analysis was performed with one-way ANOVA or the Student’s t test. All values are presented as the mean ± SEM. *p < 0.05; **p < 0.01; ***p < 0.001.
Fig. 6
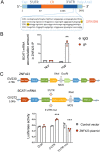
Fig. 6. ZNF423 maintaines the stable expression of BCAT1 by binding the AU-rich elements (AREs) of the 3′-UTR of BCAT1 mRNA in hypoxic PASMCs.
a The binding sites for ZNF423 in the 3′-UTR of BCAT1 mRNA. b The correlation between ZNF423 and BCAT1 mRNA was detected by real-time PCR after RNA immunoprecipitation (RIP) (n = 3). c Reporter constructs containing luciferase, and the 3′-UTR of BCAT1 mRNA and mutated 3ʹ-UTR of BCAT1 mRNA were used to estimate the activity of various luciferase reporter genes (n = 3). Nor normoxia, Hyp hypoxia, Con con083 control vector, 3′-UTR 3′-UTR luciferase reporter plasmid, 3′-UTR mut 3′-UTR ARE mutant luciferase reporter plasmid. Statistical analysis was performed with two-way ANOVA. All values are presented as the mean ± SEM. **p < 0.01; ***p < 0.001.
Fig. 7
Fig. 7. The proposed mechanism for the role of BCAT1 in PASMC autophagy.
a Hypoxia causes ZNF423 to shuttle from the nucleus to the cytoplasm, where it binds the AREs of the 3′-UTR of BCAT1 mRNA, promoting BCAT1 translation and increasing BCAT1 expression. Then, BCAT1 binds IRE1 on the endoplasmic reticulum to activate RE stress pathway proteins and the XBP1 and RIDD pathways downstream of IRE1, constituting an IRE1-XBP1-RIDD cell axis, ultimately inducing autophagy activation in PASMCs.

Similar articles

Cited by

References

    1. Hopper RK, Abman SH, Ivy DD. Persistent challenges in pediatric pulmonary hypertension. Chest. 2016;150:226–236. - PMC - PubMed
    1. Elberson VD, Nielsen LC, Wang H, Kumar HS. Effects of intermittent hypoxia and hyperoxia on angiogenesis and lung development in newborn mice. J. Neonatal Perinat. Med. 2015;8:313–322. - PubMed
    1. Soriano JB, et al. Global, regional, and national deaths, prevalence, disability-adjusted life years, and years lived with disability for chronic obstructive pulmonary disease and asthma, 1990-2015: a systematic analysis for the Global Burden of Disease Study 2015. Lancet Respir. Med. 2017;5:691–706. - PMC - PubMed
    1. Jin H, et al. Melatonin attenuates hypoxic pulmonary hypertension by inhibiting the inflammation and the proliferation of pulmonary arterial smooth muscle cells. J. Pineal Res. 2014;57:442–450. - PubMed
    1. Milara J, et al. JAK2 mediates lung fibrosis, pulmonary vascular remodelling and hypertension in idiopathic pulmonary fibrosis: an experimental study. Thorax. 2018;73:519–529. - PubMed

Publication types

MeSH terms