. 2020 Nov 9;94(23):e01334-20.
doi: 10.1128/JVI.01334-20. Print 2020 Nov 9.

Elucidating the Basis for Permissivity of the MT-4 T-Cell Line to Replication of an HIV-1 Mutant Lacking the gp41 Cytoplasmic Tail

Affiliations

Elucidating the Basis for Permissivity of the MT-4 T-Cell Line to Replication of an HIV-1 Mutant Lacking the gp41 Cytoplasmic Tail

Melissa V Fernandez et al. J Virol. .

Abstract

HIV-1 encodes an envelope glycoprotein (Env) that contains a long cytoplasmic tail (CT) harboring trafficking motifs implicated in Env incorporation into virus particles and viral transmission. In most physiologically relevant cell types, the gp41 CT is required for HIV-1 replication, but in the MT-4 T-cell line the gp41 CT is not required for a spreading infection. To help elucidate the role of the gp41 CT in HIV-1 transmission, in this study, we investigated the viral and cellular factors that contribute to the permissivity of MT-4 cells to gp41 CT truncation. We found that the kinetics of HIV-1 production and virus release are faster in MT-4 than in the other T-cell lines tested, but MT-4 cells express equivalent amounts of HIV-1 proteins on a per-cell basis relative to cells not permissive to CT truncation. MT-4 cells express higher levels of plasma-membrane-associated Env than nonpermissive cells, and Env internalization from the plasma membrane is less efficient than that from another T-cell line, SupT1. Paradoxically, despite the high levels of Env on the surface of MT-4 cells, 2-fold less Env is incorporated into virus particles produced from MT-4 than SupT1 cells. Contact-dependent transmission between cocultured 293T and MT-4 cells is higher than in cocultures of 293T with most other T-cell lines tested, indicating that MT-4 cells are highly susceptible to cell-to-cell infection. These data help to clarify the long-standing question of how MT-4 cells overcome the requirement for the HIV-1 gp41 CT and support a role for gp41 CT-dependent trafficking in Env incorporation and cell-to-cell transmission in physiologically relevant cell lines.IMPORTANCE The HIV-1 Env cytoplasmic tail (CT) is required for efficient Env incorporation into nascent particles and viral transmission in primary CD4+ T cells. The MT-4 T-cell line has been reported to support multiple rounds of infection of HIV-1 encoding a gp41 CT truncation. Uncovering the underlying mechanism of MT-4 T-cell line permissivity to gp41 CT truncation would provide key insights into the role of the gp41 CT in HIV-1 transmission. This study reveals that multiple factors contribute to the unique ability of a gp41 CT truncation mutant to spread in cultures of MT-4 cells. The lack of a requirement for the gp41 CT in MT-4 cells is associated with the combined effects of rapid HIV-1 protein production, high levels of cell-surface Env expression, and increased susceptibility to cell-to-cell transmission compared to nonpermissive cells.

Keywords: Env; HIV-1; HTLV-1; Tax; cytoplasmic tail; gp41; transmission; virological synapse.


Figures

FIG 1
FIG 1
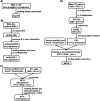
Lineage of cell lines used to interrogate T-cell line permissivity to replication of an HIV-1 mutant lacking the gp41 CT. (A) The SupT1 T-cell line was derived from a pleural effusion of a male patient with non-Hodgkin’s lymphoma. Cells were subcloned by limiting dilution to generate a cell line capable of continual growth from a single-cell colony (76). (B) The peripheral blood of a 14-year-old boy with relapsed acute lymphocytic leukemia (ALL) was used to generate the EBV, IL-2-dependent JM T-cell line (77). The JM line was then subcloned to generate the Jurkat-FHCRC subclone for its ability to produce IL-2 upon stimulation with phorbol esters or lectins (116). The “-FHCRC” designation indicates the cell line originated at the Fred Hutchinson Cancer Research Center. Jurkat-FHCRC was then subjected to limiting dilution to generate an IL-2 -independent, mycoplasma-free cell line, Jurkat E6.1 (117). (C) To generate the MT-4 cell line, cells from an adult male ATL patient were cocultured with male human infant cord leukocytes, and therefore it is unknown whether these cells are of cord leukocyte or ATL cell origin (78). Cells were gifted to the lab of Douglas Richman by Harada et al. (118) and serially passaged by terminal dilution cloning of the cells in the presence of ciprofloxacin until they were determined to be mycoplasma free. These cells were then donated to the NIH ARP by Douglas Richman (D. Richman, personal communication). (D) To generate the C8166 T-cell line, cells were first acquired from a 26-year-old male ATL patient’s inguinal lymph node (119) and maintained in IL-2 for several passages until they were deemed IL-2 independent (120). This T-cell line, HUT 102, was determined to be EBV and HTLV+. The CR-M2 subclone of HUT 102 was then isolated and further purified by percoll gradient isolation to generate a cell line with increased HTLV production, designated CRII (121). CRII was then used to transform human umbilical cord blood T leukocytes by cell hybridization to generate the C63/CRII-2 cell line, also known as (aka) the C8166-45 (aka 81-66 or C8166) cell line (79). The “-45” designation indicates the cell line has 45 chromosomes. “CR” indicates the cells were transformed by the HTLV-1CR virus. Characterization of this line found that it produces HTLV-1 RNA but no virus particles (79). C8166 cells were then subjected to limiting dilution to generate a clone more susceptible to formation of syncytia when cultures were infected with HIV-1 (122). This new C8166-derived cell line was named M8166.
FIG 2
FIG 2
Spreading infection kinetics of SIVmac239 in C8166 and M8166. (A) C8166 and (B) M8166 were transfected with SIVmac239 encoding the indicated Env CT genotype. Supernatant was sampled every 2 to 3 days for analysis by HIV-1 RT assay, and cell cultures were split 1/2. Data are representative of 3 independent experiments.
FIG 3
FIG 3
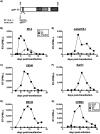
MT-4 is the only T-cell line tested that is permissive to the gp41 CT truncation mutant CTdel144. (A) Schematic representation of the NL4-3 gp41 CT and gp41 CT genotypes used in this study. The lentiviral lytic peptide (LLP) domains are indicated in gray boxes, and the highly conserved tyrosine endocytosis motif is indicated with a shaded black rectangle. The CTdel144 mutant was generated by introducing two stop codons in the highly conserved tyrosine endocytosis motif, resulting in a CT of 4 amino acids (43). The numbers above the gp41 CT schematic indicate the first and last amino acid positions of the gp41 CT. The number below the gp41 CT indicates the position of the QGYSPL sequence. The tyrosine endocytosis motif, GYSPL, is underlined. (B to G) Replication curves for spreading infection are shown. (B to F) Cell lines were either mock transfected or transfected with pNL4-3 encoding the indicated gp41 CT genotype. Cells were split (B to D) 1/2 or (E to F) 1/3 every 2 to 3 days, and an aliquot of the supernatant was reserved for analysis of HIV-1 RT activity at each time point. (G) hPBMCs were transduced with VSV-G-pseudotyped NL4-3 encoding the indicated gp41 CT genotype or mock infected. Supernatant was sampled every 2 to 3 days for analysis of HIV-1 RT activity, and cell cultures were supplemented with fresh medium. Data are representative of 3 independent experiments (B to F) and 3 donors (G).
FIG 4
FIG 4
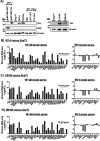
NF-κB-target gene expression in Tax-expressing T-cell lines is higher than in SupT1. (A) Cell lysates from the indicated cell lines were analyzed by Western blotting for HTLV-1 Tax expression. 293T cells were transfected with a GFP expression vector as a transfection control or a Tax expression vector as a control for antibody specificity. ATL Tax-deficient cells were included as the negative control for Tax expression in immortalized T-cell lines. (B to D) RNA levels of the indicated NF-κB- and IRF3-target genes were compared to SupT1. RNA levels were determined by Illumina RNA-seq. As described in more detail in Materials and Methods, comparisons are reported as the log2 of the fold change (FC) of the HTLV-transformed line (MT-4, C8166, or M8166) relative to the lymphoma-derived T-cell line, SupT1.
FIG 5
FIG 5
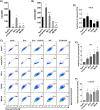
Viral entry mediated by full-length and CT-truncated Env is equivalent among HTLV-transformed T-cell lines. (A) Surface CD4 and (B) CXCR4 were measured by flow cytometry. MFI was determined by measuring the MFI value of CD4+ or CXCR4+ histograms and subtracting the isotype control MFI to directly compare MFIs between samples. To account for fluctuations in flow cytometry data that occur when comparing data from different experiments, cells from different acquisition dates were stained with antibody, fixed, and analyzed in parallel by flow cytometry. The bar graphs show the mean MFI values of cell surface (A) CD4 and (B) CXCR4, ± standard deviation (SD) from three independent experiments and the bar shading for ease of comparison between panels A and B. (C) BlaM-Vpr-based viral entry assays were performed using NL4-3 expressing either WT or CTdel144 Env. A mock treatment and Env NL4-3 pseudotyped with VSV-G were used as a positive control, and Env was used as a negative control. Representative FACS dot plots are shown. The virus dose used for each condition was titrated to avoid saturation (in the case of VSV-G and WT) and to be above the Env conditions (in the case of CTdel144). Therefore, values can only be compared between cell lines for each condition, not between conditions. (D to F)The bar graphs show the fold change in viral entry relative to SupT1 (set at 1) between (D) VSV-G-pseudotyped Env NL4-3, (E) WT NL4-3, and (F) CTdel144 NL4-3 with SD representing comparison of values derived from three independent experiments. Statistical significance was assessed by one-way ANOVA and Tukey’s multiple-comparison test. P values are defined in Materials and Methods.
FIG 6
FIG 6
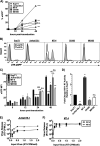
MT-4 cultures release more virus than other T-cell lines due to more rapid viral protein production. Cells were transduced with VSV-G-pseudotyped pBR43IeGFP-nefEnv reporter virus and collected at various time points. (A) The percentage of cells expressing eGFP at each time point was plotted. Error bars indicating the standard deviation of duplicate infections are too small to be seen. (B) Histogram of eGFP expression in the cell lines 48-hours postransduction indicating the percentage of cells expressing eGFP and their MFI relative to an eGFP control. (C) eGFP levels at various time points postransduction (p.t.) were determined by the eGFP MFI from which the background MFI from the eGFP construct was subtracted. The bar graph shows the mean eGFP MFI, ± SD, from three independent experiments. (D) Cell lines were transduced with VSV-G-pseudotyped NL4-3 Env and washed, and supernatant HIV-1 RT activity was measured 42-hours postransduction. The bar graph shows the mean fold change relative to the SupT1 reference line, ± SD, from three independent experiments. (E and F) An equal number of Jurkat E6.1 and MT-4 cells were transduced with an increasing dose of VSV-G-pseudotyped pBR43IeGFP-nefEnv reporter virus, and supernatant RT release was measured at 24 and 48 hours postransduction. (A to D) Statistical analysis was performed to compare cell lines relative to SupT1 at individual time points postransduction or between two samples as indicated by the horizontal line between two bars. n.s. indicates no statistical difference between the indicated cell line and the SupT1 reference or between two samples as indicated by the horizontal line between two bars. Statistical significance was assessed by one-way ANOVA and Tukey’s multiple-comparison test.
FIG 7
FIG 7
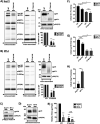
Virion Env incorporation in MT-4 cells is inefficient. SupT1 (A) and MT-4 (B) cells were transduced with RT-normalized VSV-G-pseudotyped NL4-3 encoding either WT or CTdel144 Env. Cells were metabolically labeled with [35S]Cys, and cell and virus lysates were immunoprecipitated to detect HIV proteins. The locations of p66(RT), the Gag precursor Pr55Gag, p32(IN), and p24(CA) are indicated. Western blotting was performed on the virus fraction to detect gp41 and p24(CA) using equal amounts of WT and CTdel144 viral lysates. gp41.t indicates the position of the truncated gp41, CTdel144. The fold change in Env incorporation between WT and CTdel144 Env, calculated by determining the ratio of virion-associated gp41 to p24(CA) relative to the WT condition, is indicated below the Western blots. (C and D) SupT1 and MT-4 were transduced as in panels A and B, and RT-normalized virus was used to compare gp41 content in the virus fraction. (C) Samples were analyzed by [35S]Cys radio-immunoprecipitation (IP) and (D) Western blots (detected by chemiluminescence). (E) Mean values of WT and CTdel144 gp41 incorporation into virions, with the WT gp41/p24 ratio in SupT1 set at 100. gp41 and p24 values were obtained from panels A and B. Error bars represent ± SD from three independent experiments. (F) Env processing efficiency was quantified by dividing cell-associated gp120 by the total cell-associated Env band intensity (gp120/[gp120+gp160]). (G) The cell-associated Env-to-Gag ratio was determined as (gp120/[Pr55Gag+p24]). (H) Gag processing was determined by dividing p24(CA) by total Gag band intensity. In panels E to G, the bar graphs show the mean values ± SD from three independent experiments. n.s. indicates no statistical difference between two samples as indicated by the horizontal line. Statistical significance was assessed by one-way ANOVA and Tukey’s multiple-comparison test (E to G) or paired Student's t test (A, B, and H).
FIG 8
FIG 8
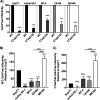
Infectivity of virions produced from MT-4 cells does not explain their permissivity to gp41 CT truncation. Cells were transduced with VSV-G-pseudotyped NL4-3 encoding either WT or CTdel144 Env. Viral supernatant was collected 42 hours postransduction. Supernatants were RT normalized, and a serial dilution of virus was used to infect TZM-bl cells. Luciferase values were then used to determine the relative infectivity of virus produced from each T-cell line. (A) The bar graph shows the mean values of CTdel144 relative to WT (set at 100) ± SD from three independent experiments. (B and C) The same virus was used as in panel A to compare WT and CTdel144 virus infectivity between cell lines. The bar graphs show the mean values of (B) WT and (C) CTdel144 relative to the SupT1 reference line (set at 100) ± SD from three independent experiments. Shading of individual columns indicates values for the individual cell lines for ease of comparison between data sets in panels A to C. Statistics relative to the SupT1 reference line, or between two samples as indicated by the horizontal line between two bars, are shown. n.s. indicates no statistical difference between the indicated cell line to the SupT1 reference. Statistical significance was assessed by (A) Student's t test and (B to C) one-way ANOVA and Tukey’s multiple-comparison test.
FIG 9
FIG 9
MT-4 cells express higher levels of surface CT-truncated Env than other T-cell lines tested as determined by flow cytometry. VSV-G-pseudotyped NL4-3 encoding either WT or Ctdel144 Env or no Env (Env) was used to transduce T cells. Forty hours postransduction, cells were fixed and stained with anti-Env antibodies for analysis by flow cytometry. (A) A histogram of surface Env for each cell line is shown. Env cells were used as a control for background staining. (B) Surface Env MFI was determined by measuring the MFI value of the Env+ histogram and subtracting the Env MFI to directly compare MFIs between samples. To account for fluctuations in flow cytometry data that occur when comparing data from three independent experiments, cells were stained with antibody and analyzed in parallel by flow cytometry. The bar graph shows the mean values of WT and CTdel144 Env MFI ± SD from three independent experiments. n.s. indicates no statistical difference between WT and CTdel144 for the M8166 cell line. Error bars ± SD from 3 independent experiments. Statistical significance was assessed by Student's t test.
FIG 10
FIG 10
MT-4 cells express higher levels of Env than SupT1, which is further enhanced by truncating the gp41 CT, as determined by confocal microscopy. MT-4 or SupT1 cells were infected with a replication-and-release-defective HIV-1 mutant (described in Materials and Methods) expressing an eGFP reporter (yellow) and either WT or CTdel144 Env. Approximately 40 hours postinfection, cells were simultaneously pulsed with anti-Env Fab b12-Atto565 (magenta) and transferrin-AF647 (blue) for 12 min and then chased for 50 min. Cells were fixed and imaged by confocal fluorescence microscopy. (A) Representative confocal slices of transduced MT-4 or Jurkat E6.1 cells after the pulse-chase labeling. Scale bars, 15 μm; inset scale bars, 3 μm. (B) Total surface Env and total internal Env per cell were measured using the integrated fluorescence intensity for regions defining the PM of the cell (surface) and a region defining the interior of the cell (internal), using a maximum intensity projection through a 4.5-μm confocal range centered in the approximate middle of a single cell. n = 50 infected cells per sample. The bar graph shows the mean values of surface and internal Env levels. (C) Percentage Env internalization was calculated as the percentage of internal Env above the total Env signal (internal and surface). The scatterplot shows the mean values of percentage internalized Env. n = 50 infected cells per sample. Error bars ± SEM. Statistical significance was assessed by one-way ANOVA and Tukey’s multiple-comparison test.
FIG 11
FIG 11
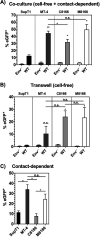
MT-4 cells serve as better targets for contact-dependent transmission than the other cell lines tested. 293T cells were transfected with pBR43IeGFP-nef encoding either WT Env or Env. Twenty-four hours posttransfection, dye-labeled T cells were either cocultured or added to a transwell exposed to the 293T supernatant. Eighteen hours postcoculture, BMS-806 was added to prevent multiple cycles of infection and the formation of syncytia. 48 hours post-initial coculture, cells were collected, fixed, and analyzed by flow cytometry. (A and B) The percentage of cells expressing eGFP was determined and plotted. (C) The transwell value was subtracted from the coculture value to determine the contribution of cell-to-cell transmission. The bar graphs show the mean values of the percentage of cells positive for eGFP expression for the panel A coculture, the panel B transwell (cell-free), and the C-C transmission in panel C ± SD from three independent experiments. Shading of individual columns indicates values for the cell line for ease of comparison between data sets. n.s. indicates no statistically significant difference between the indicated cell line and the SupT1 reference or between two samples as indicated by the horizontal line connecting two bars. Statistical significance was assessed by one-way ANOVA and Tukey’s multiple-comparison test.

Similar articles

Cited by

References

    1. Willey RL, Klimkait T, Frucht DM, Bonifacino JS, Martin MA. 1991. Mutations within the human immunodeficiency virus type 1 gp160 envelope glycoprotein alter its intracellular transport and processing. Virology 184:319–329. doi:10.1016/0042-6822(91)90848-6. - DOI - PubMed
    1. Hallenberger S, Bosch V, Angliker H, Shaw E, Klenk HD, Garten W. 1992. Inhibition of furin-mediated cleavage activation of HIV-1 glycoprotein gp160. Nature 360:358–361. doi:10.1038/360358a0. - DOI - PubMed
    1. Pinter A, Honnen WJ, Tilley SA, Bona C, Zaghouani H, Gorny MK, Zolla-Pazner S. 1989. Oligomeric structure of gp41, the transmembrane protein of human immunodeficiency virus type 1. J Virol 63:2674–2679. doi:10.1128/JVI.63.6.2674-2679.1989. - DOI - PMC - PubMed
    1. Doms RW, Earl PL, Moss B. 1991. The assembly of the HIV-1 env glycoprotein into dimers and tetramers. Adv Exp Med Biol 300:203–219. discussion 220–221. doi:10.1007/978-1-4684-5976-0_13. - DOI - PubMed
    1. Checkley MA, Luttge BG, Freed EO. 2011. HIV-1 envelope glycoprotein biosynthesis, trafficking, and incorporation. J Mol Biol 410:582–608. doi:10.1016/j.jmb.2011.04.042. - DOI - PMC - PubMed

Publication types

Substances