. 2021 Mar 11;137(10):1392-1405.
doi: 10.1182/blood.2019004617.

Xenotropic and polytropic retrovirus receptor 1 regulates procoagulant platelet polyphosphate

Affiliations

Xenotropic and polytropic retrovirus receptor 1 regulates procoagulant platelet polyphosphate

Reiner K Mailer et al. Blood. .

Abstract

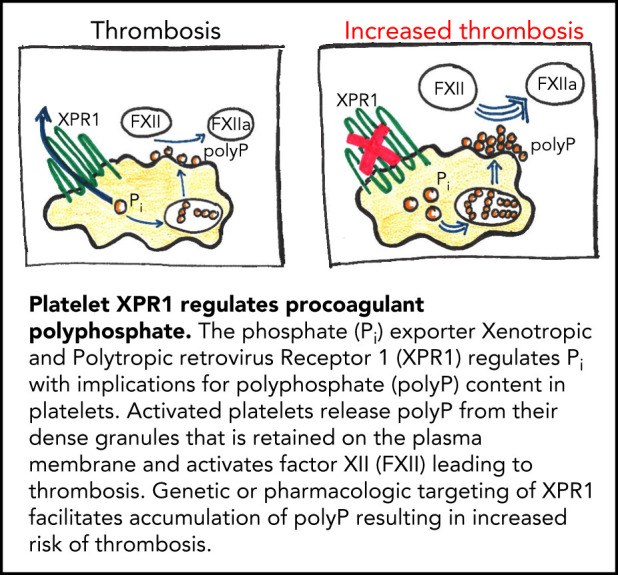
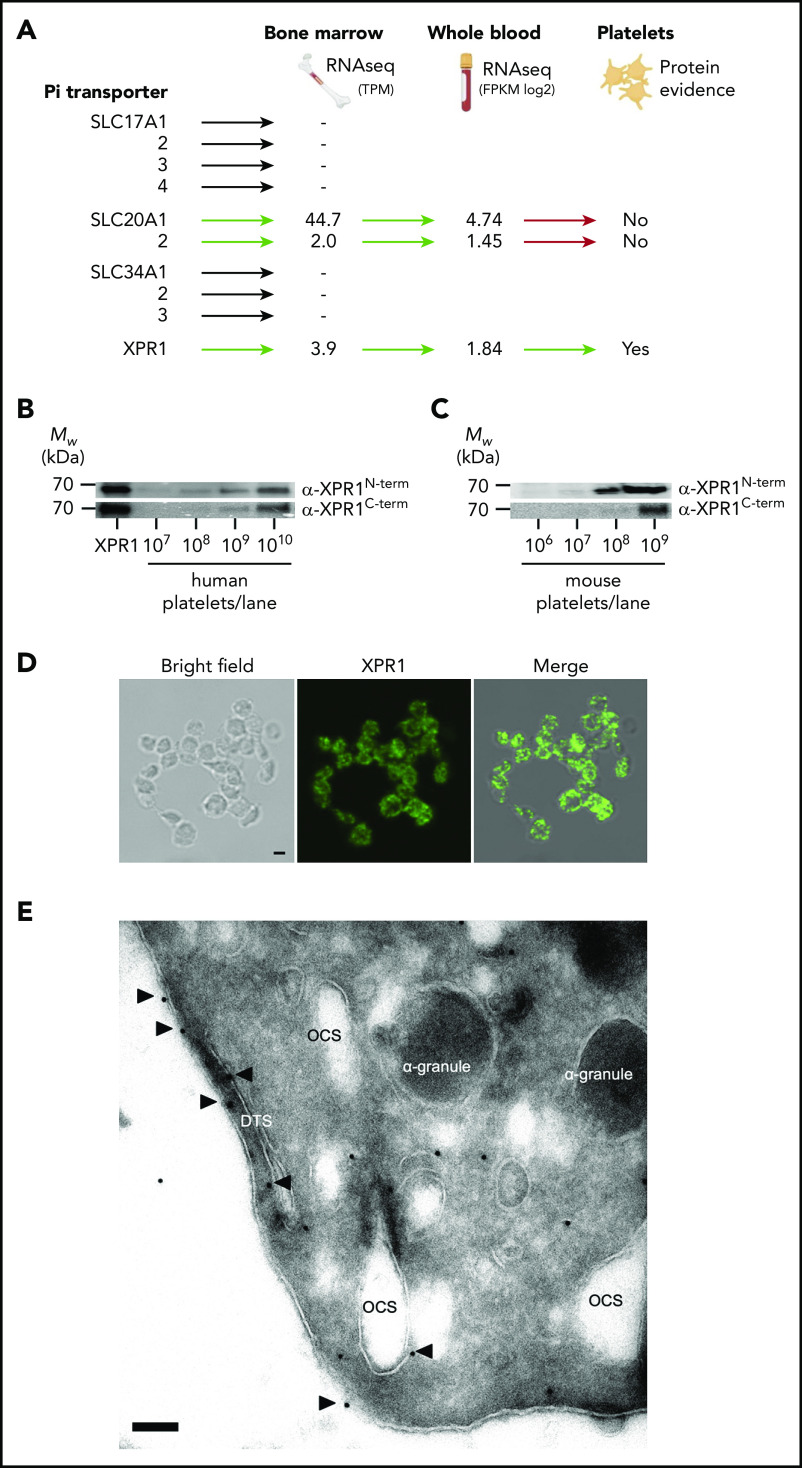
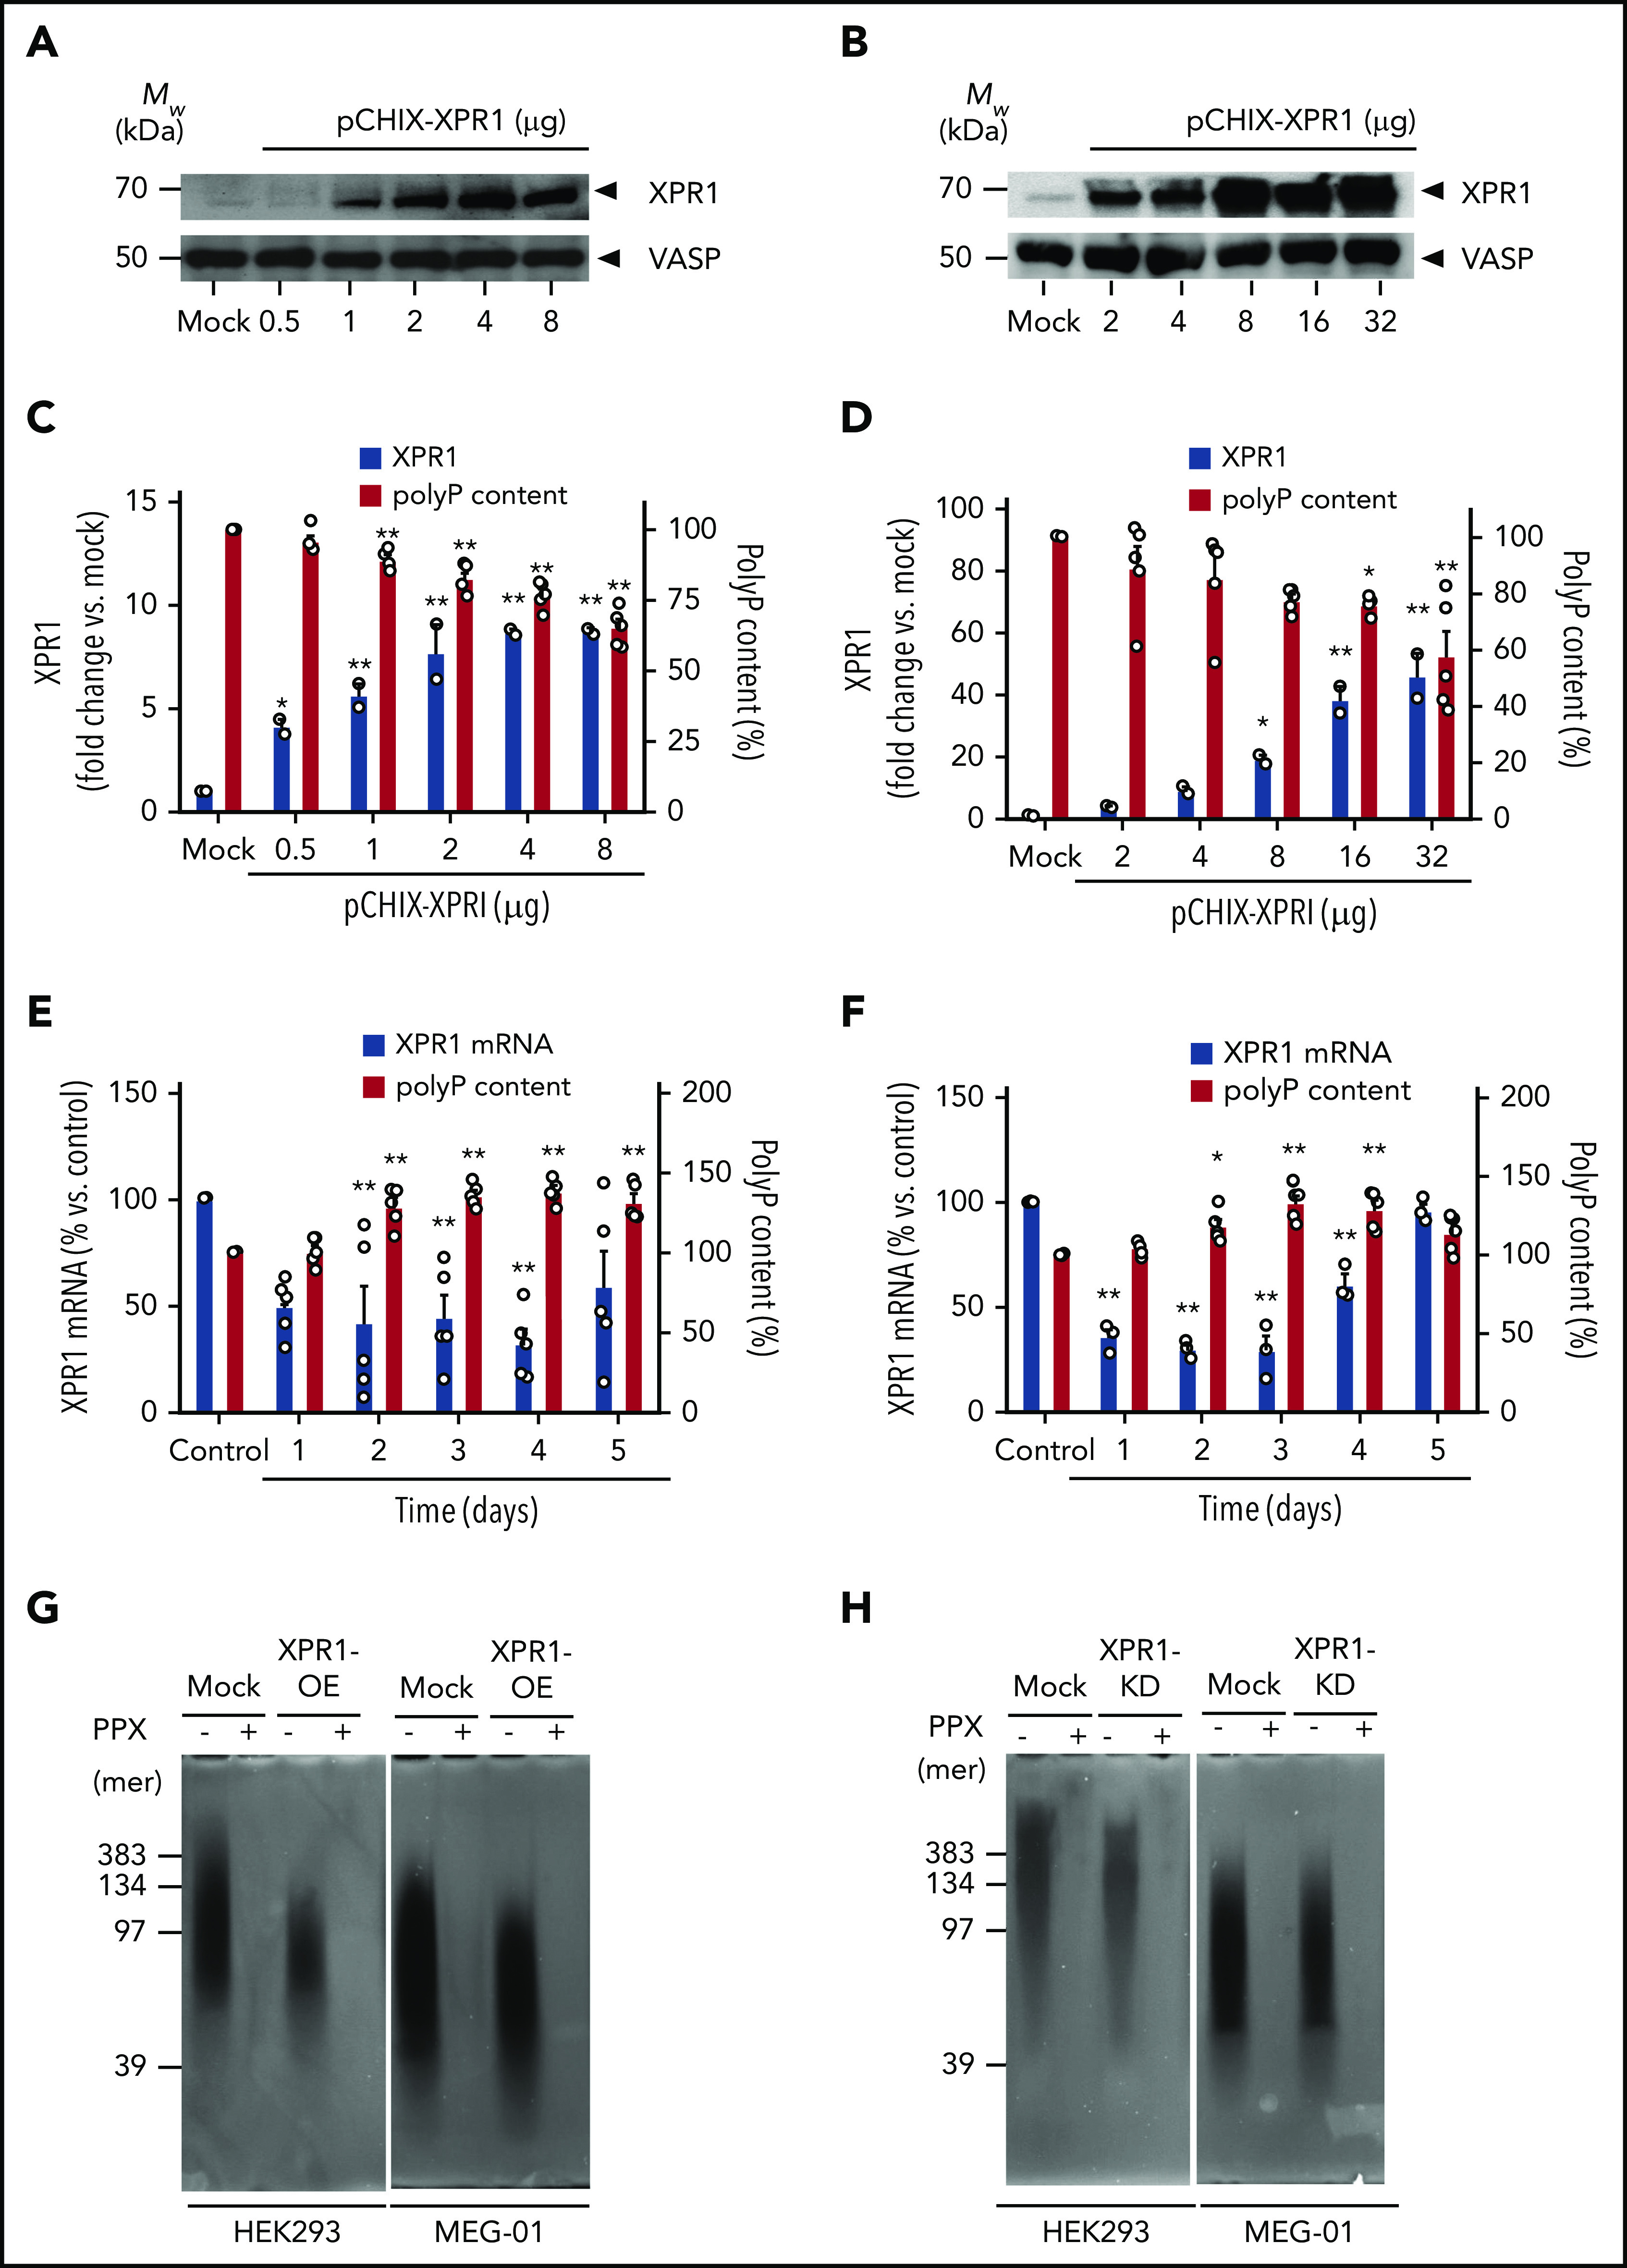
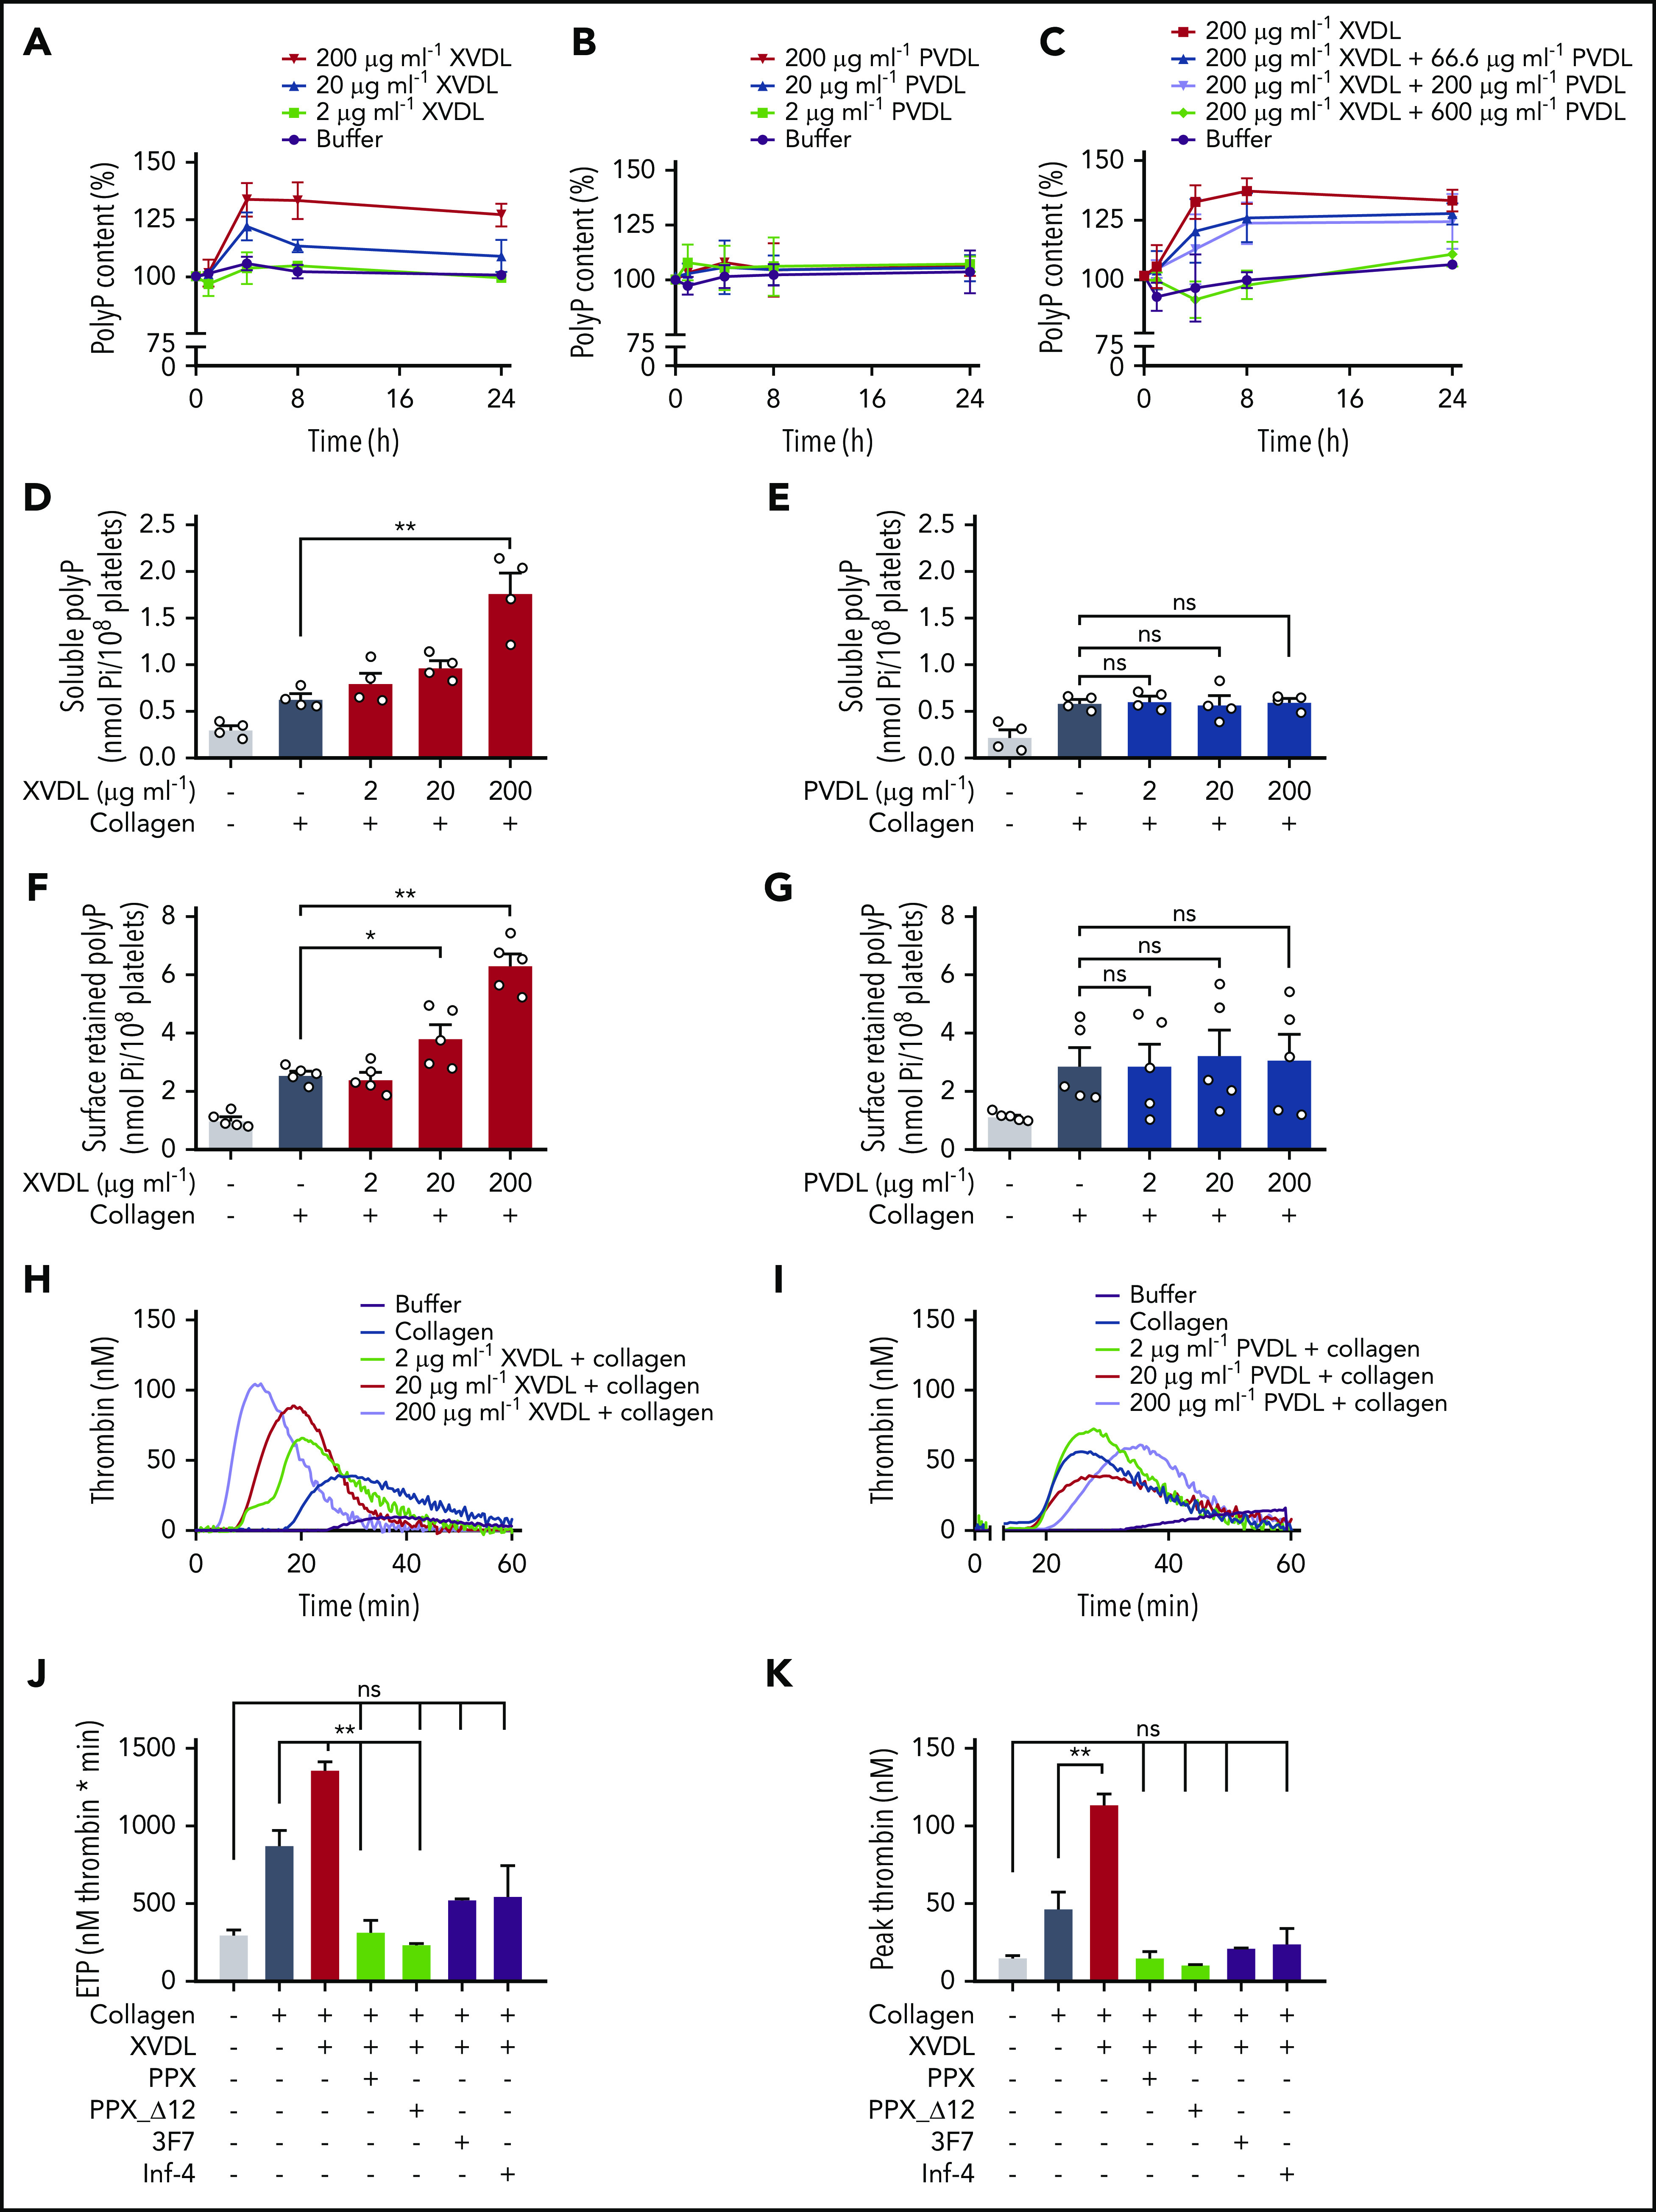
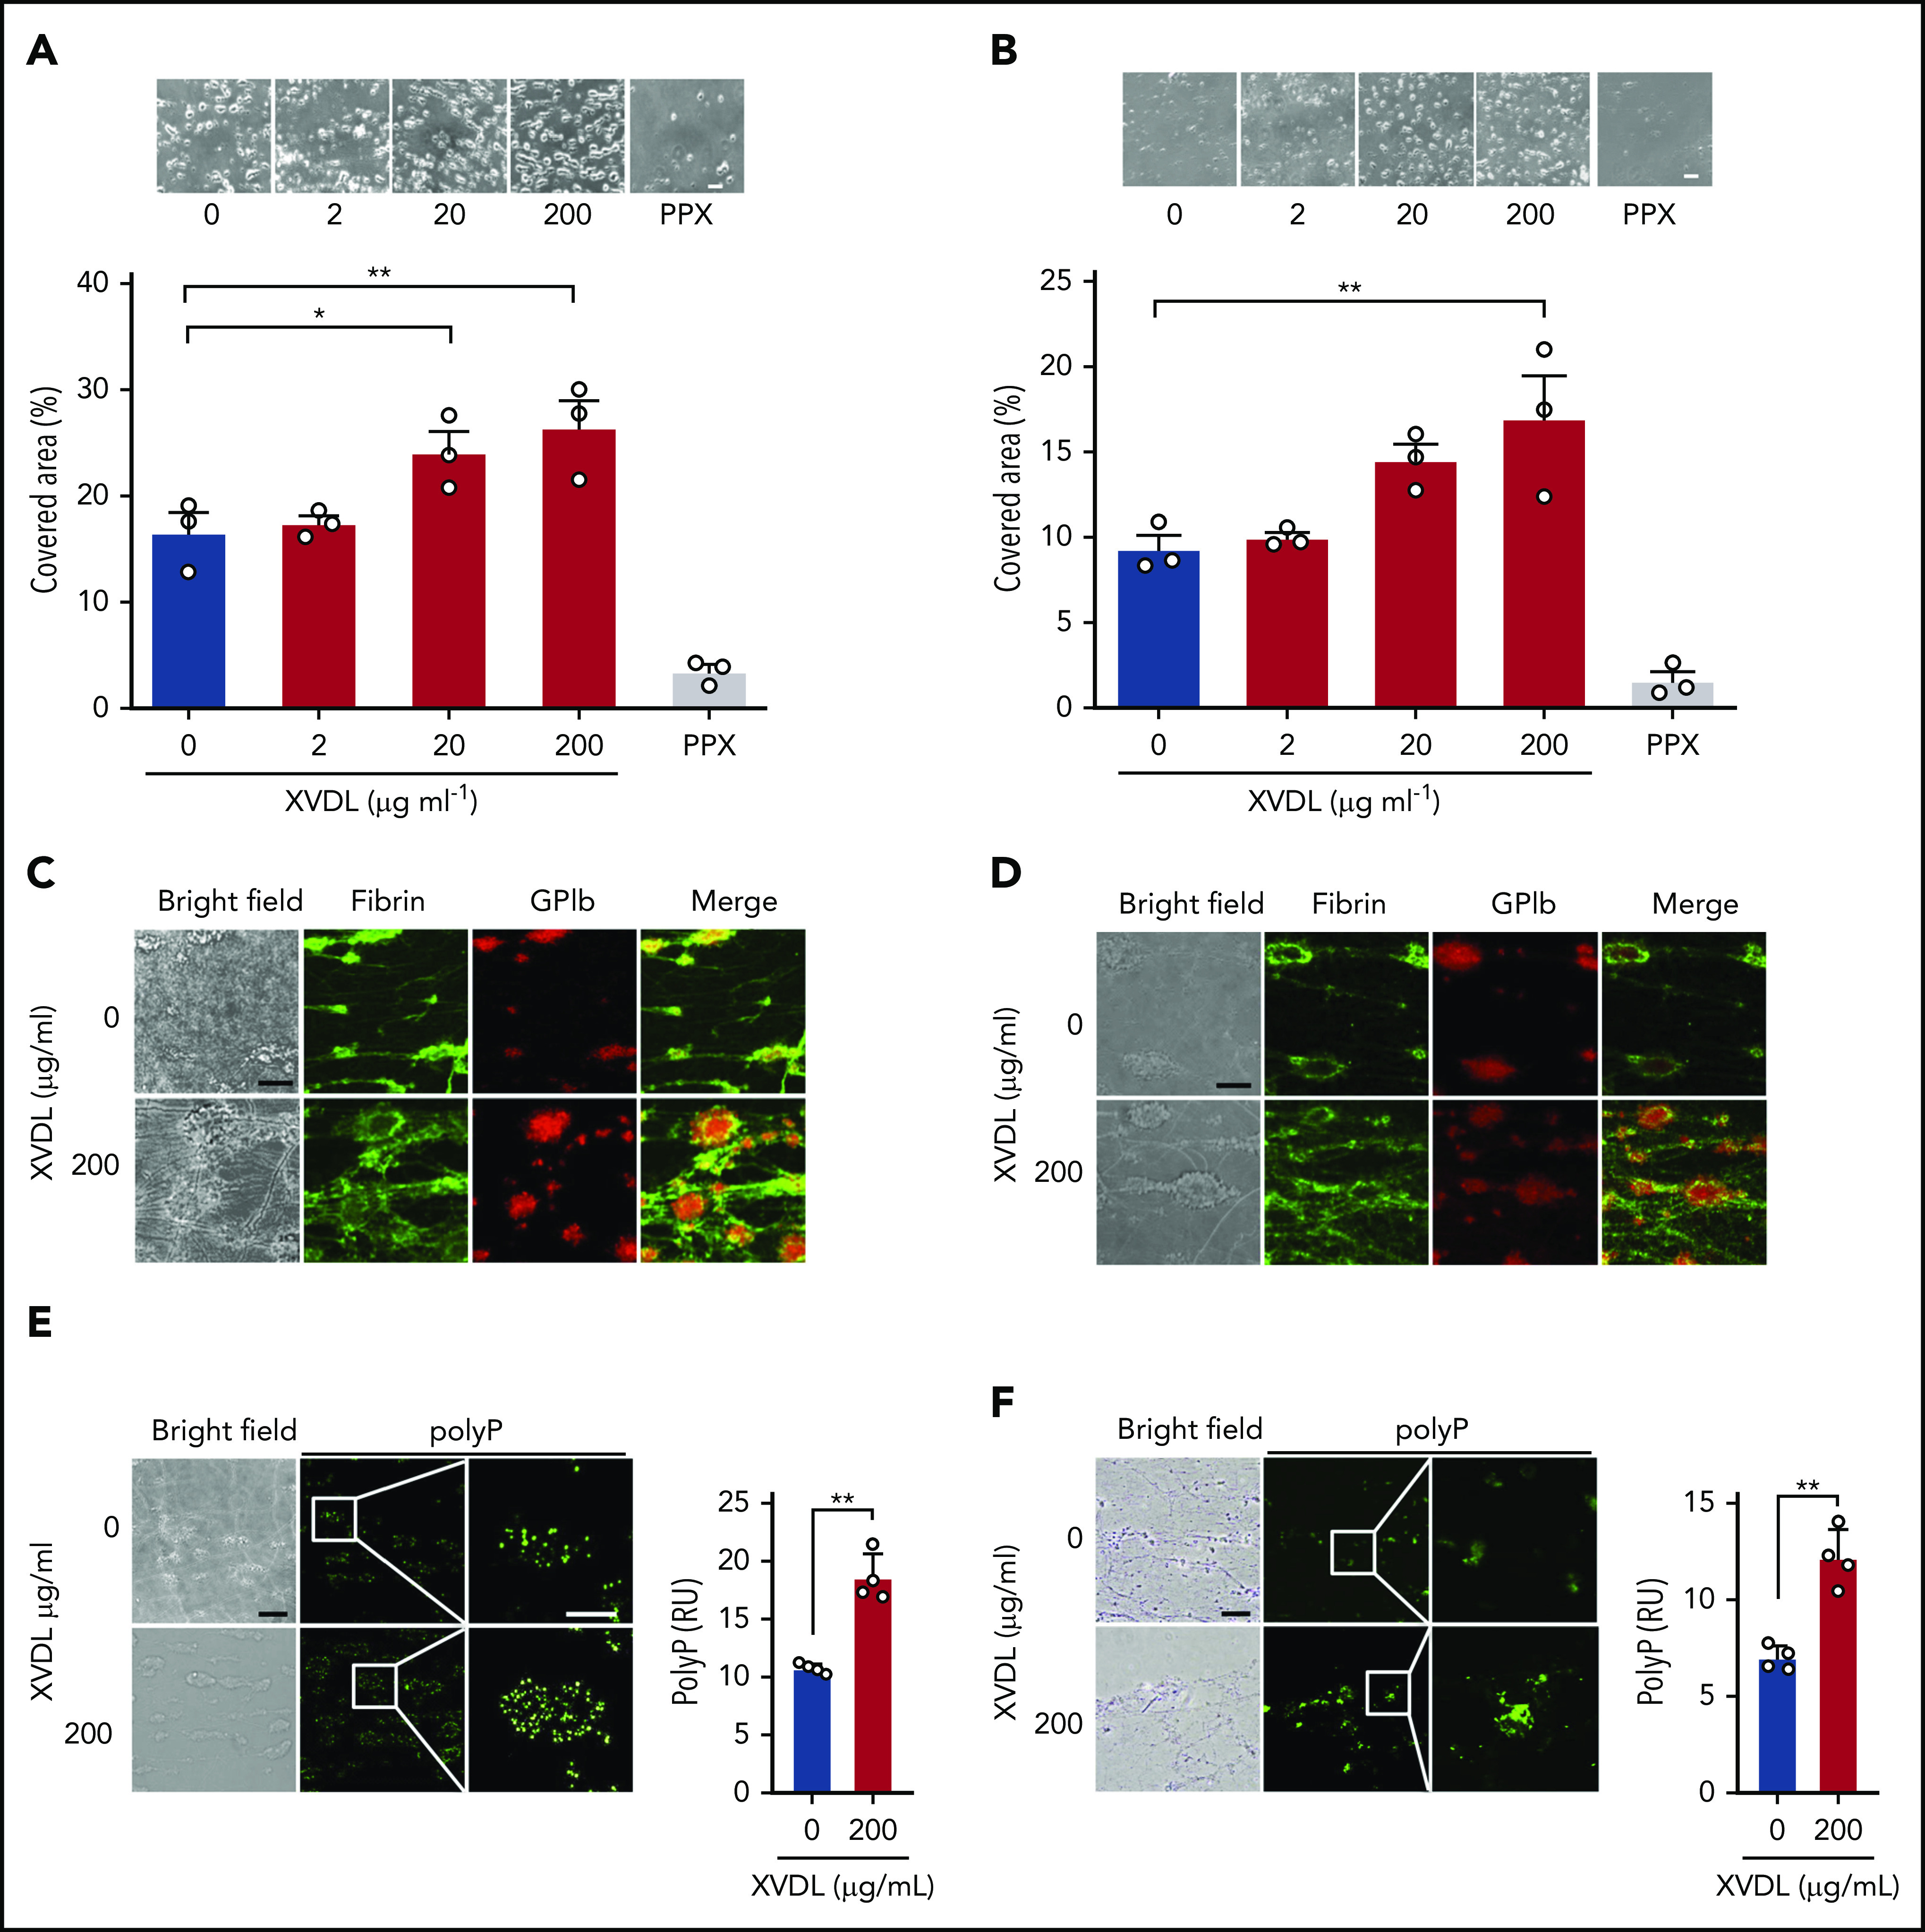
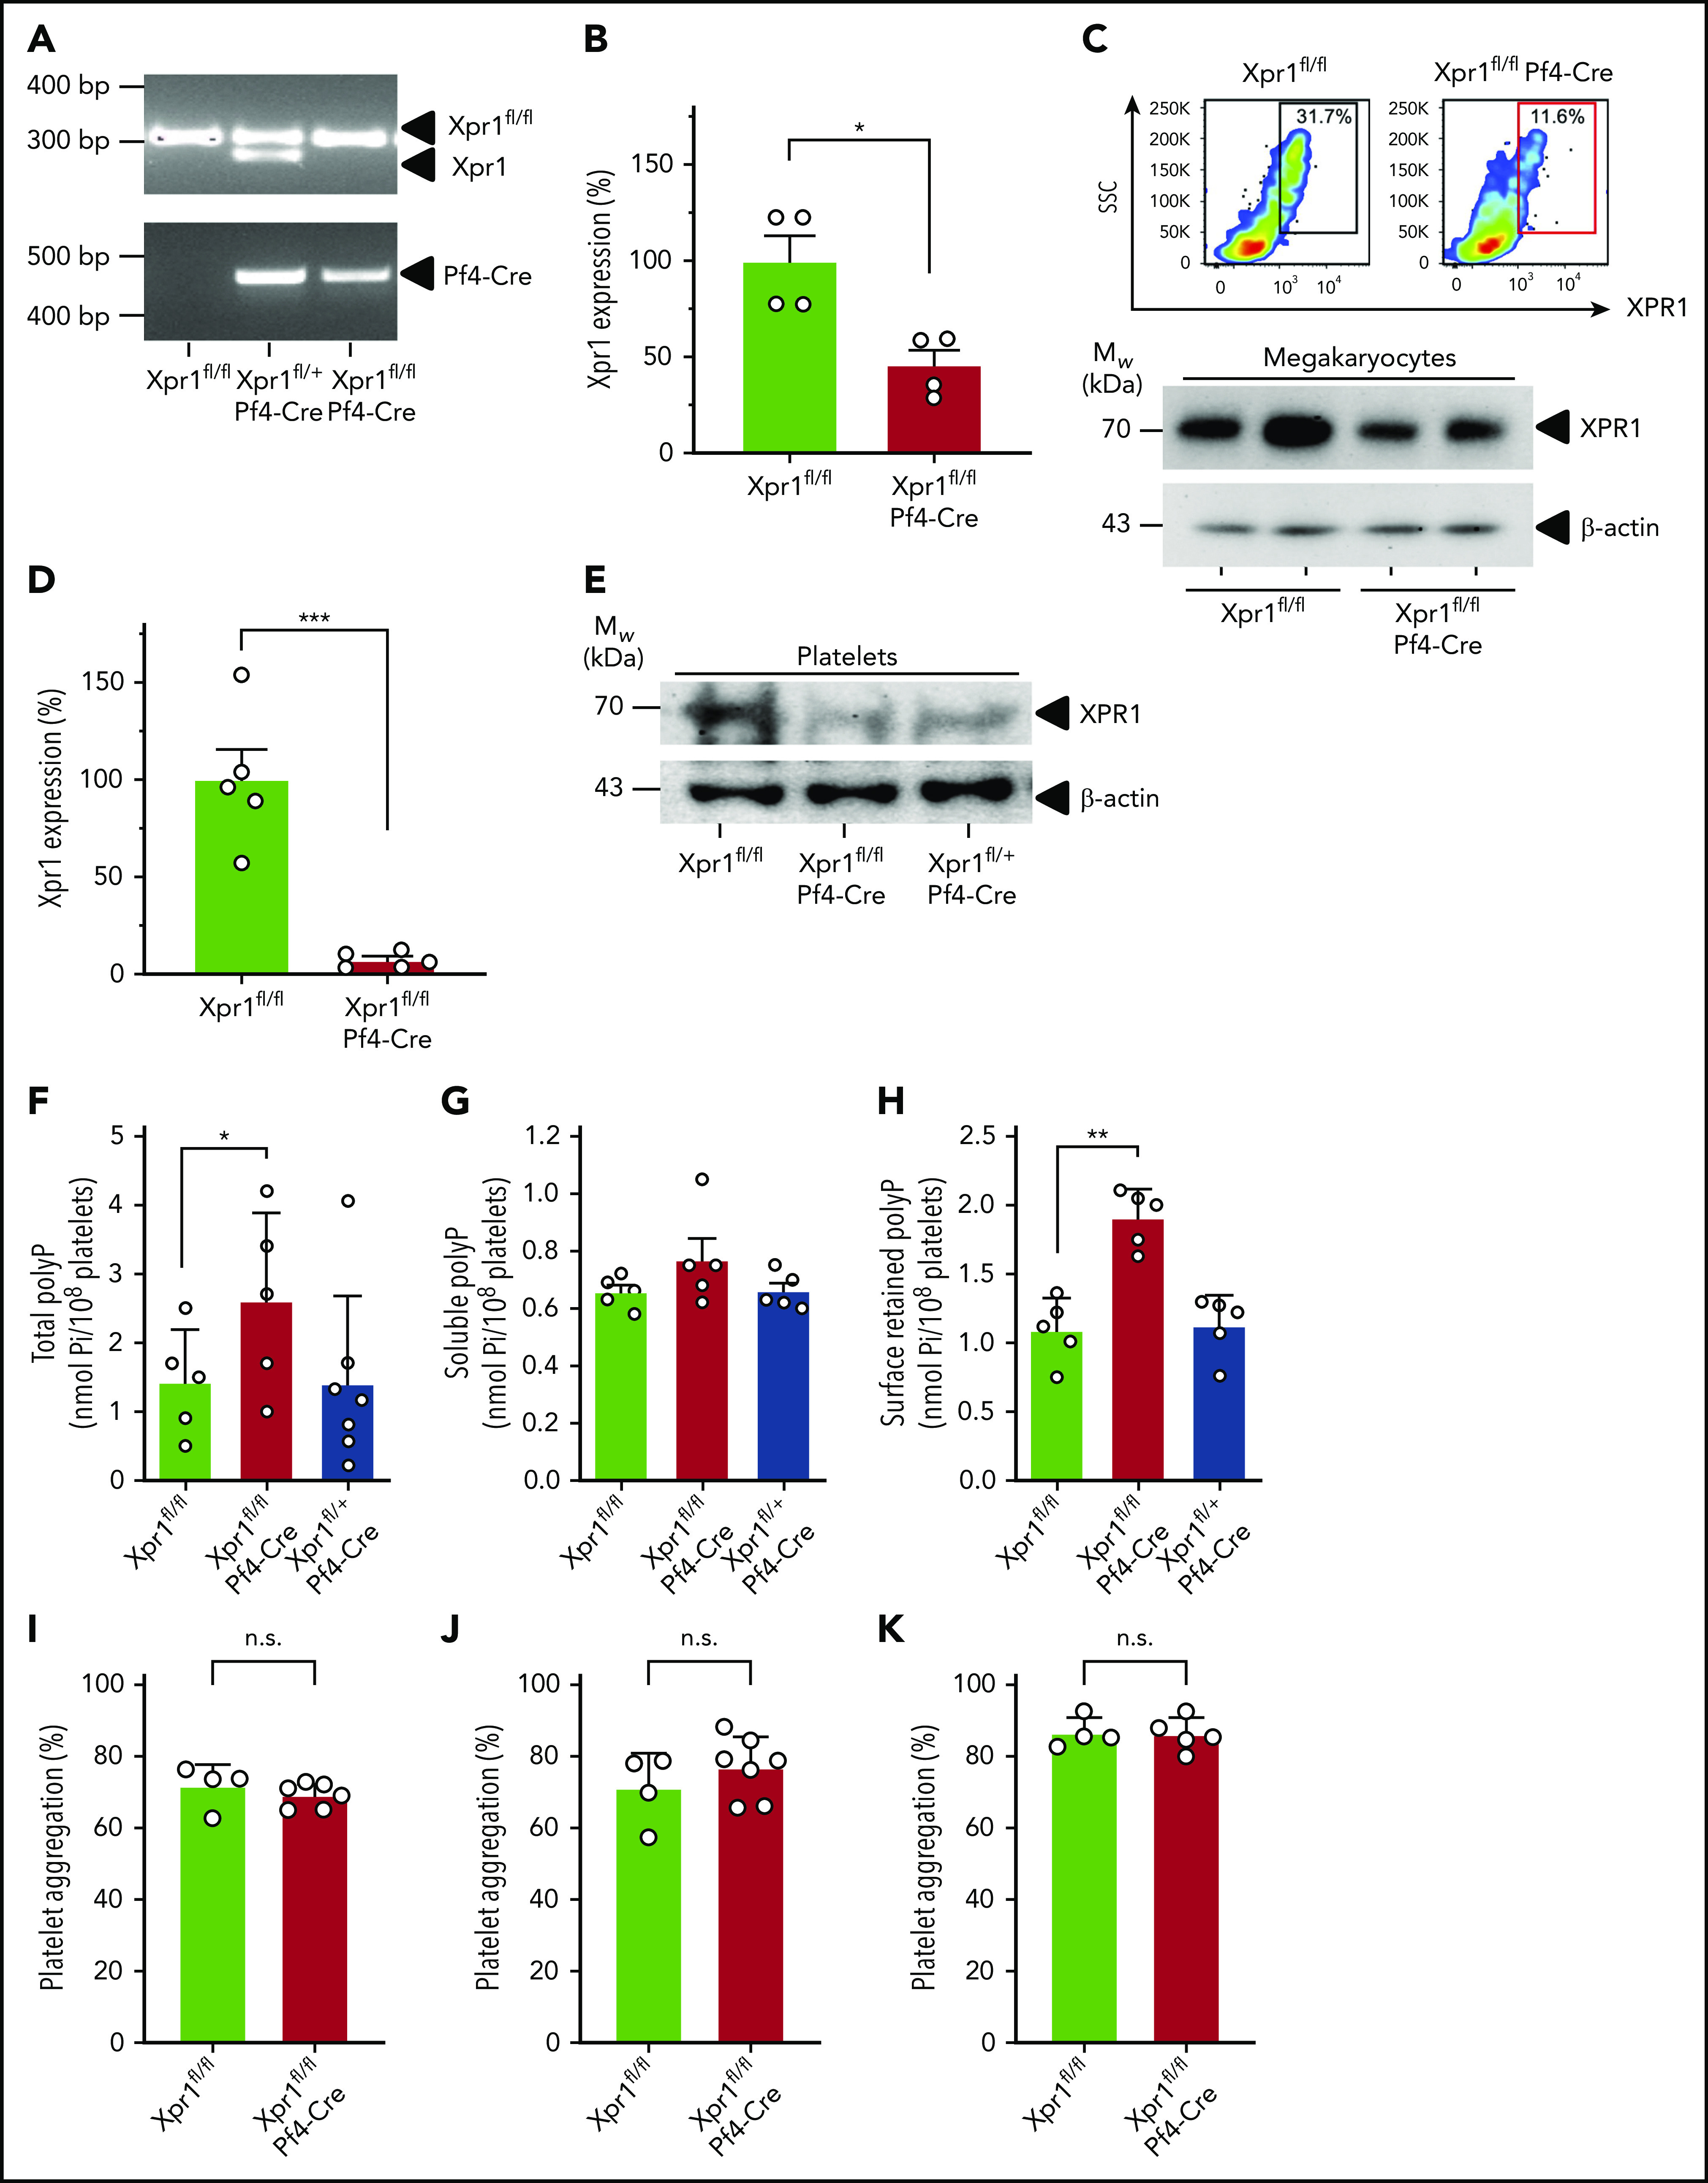
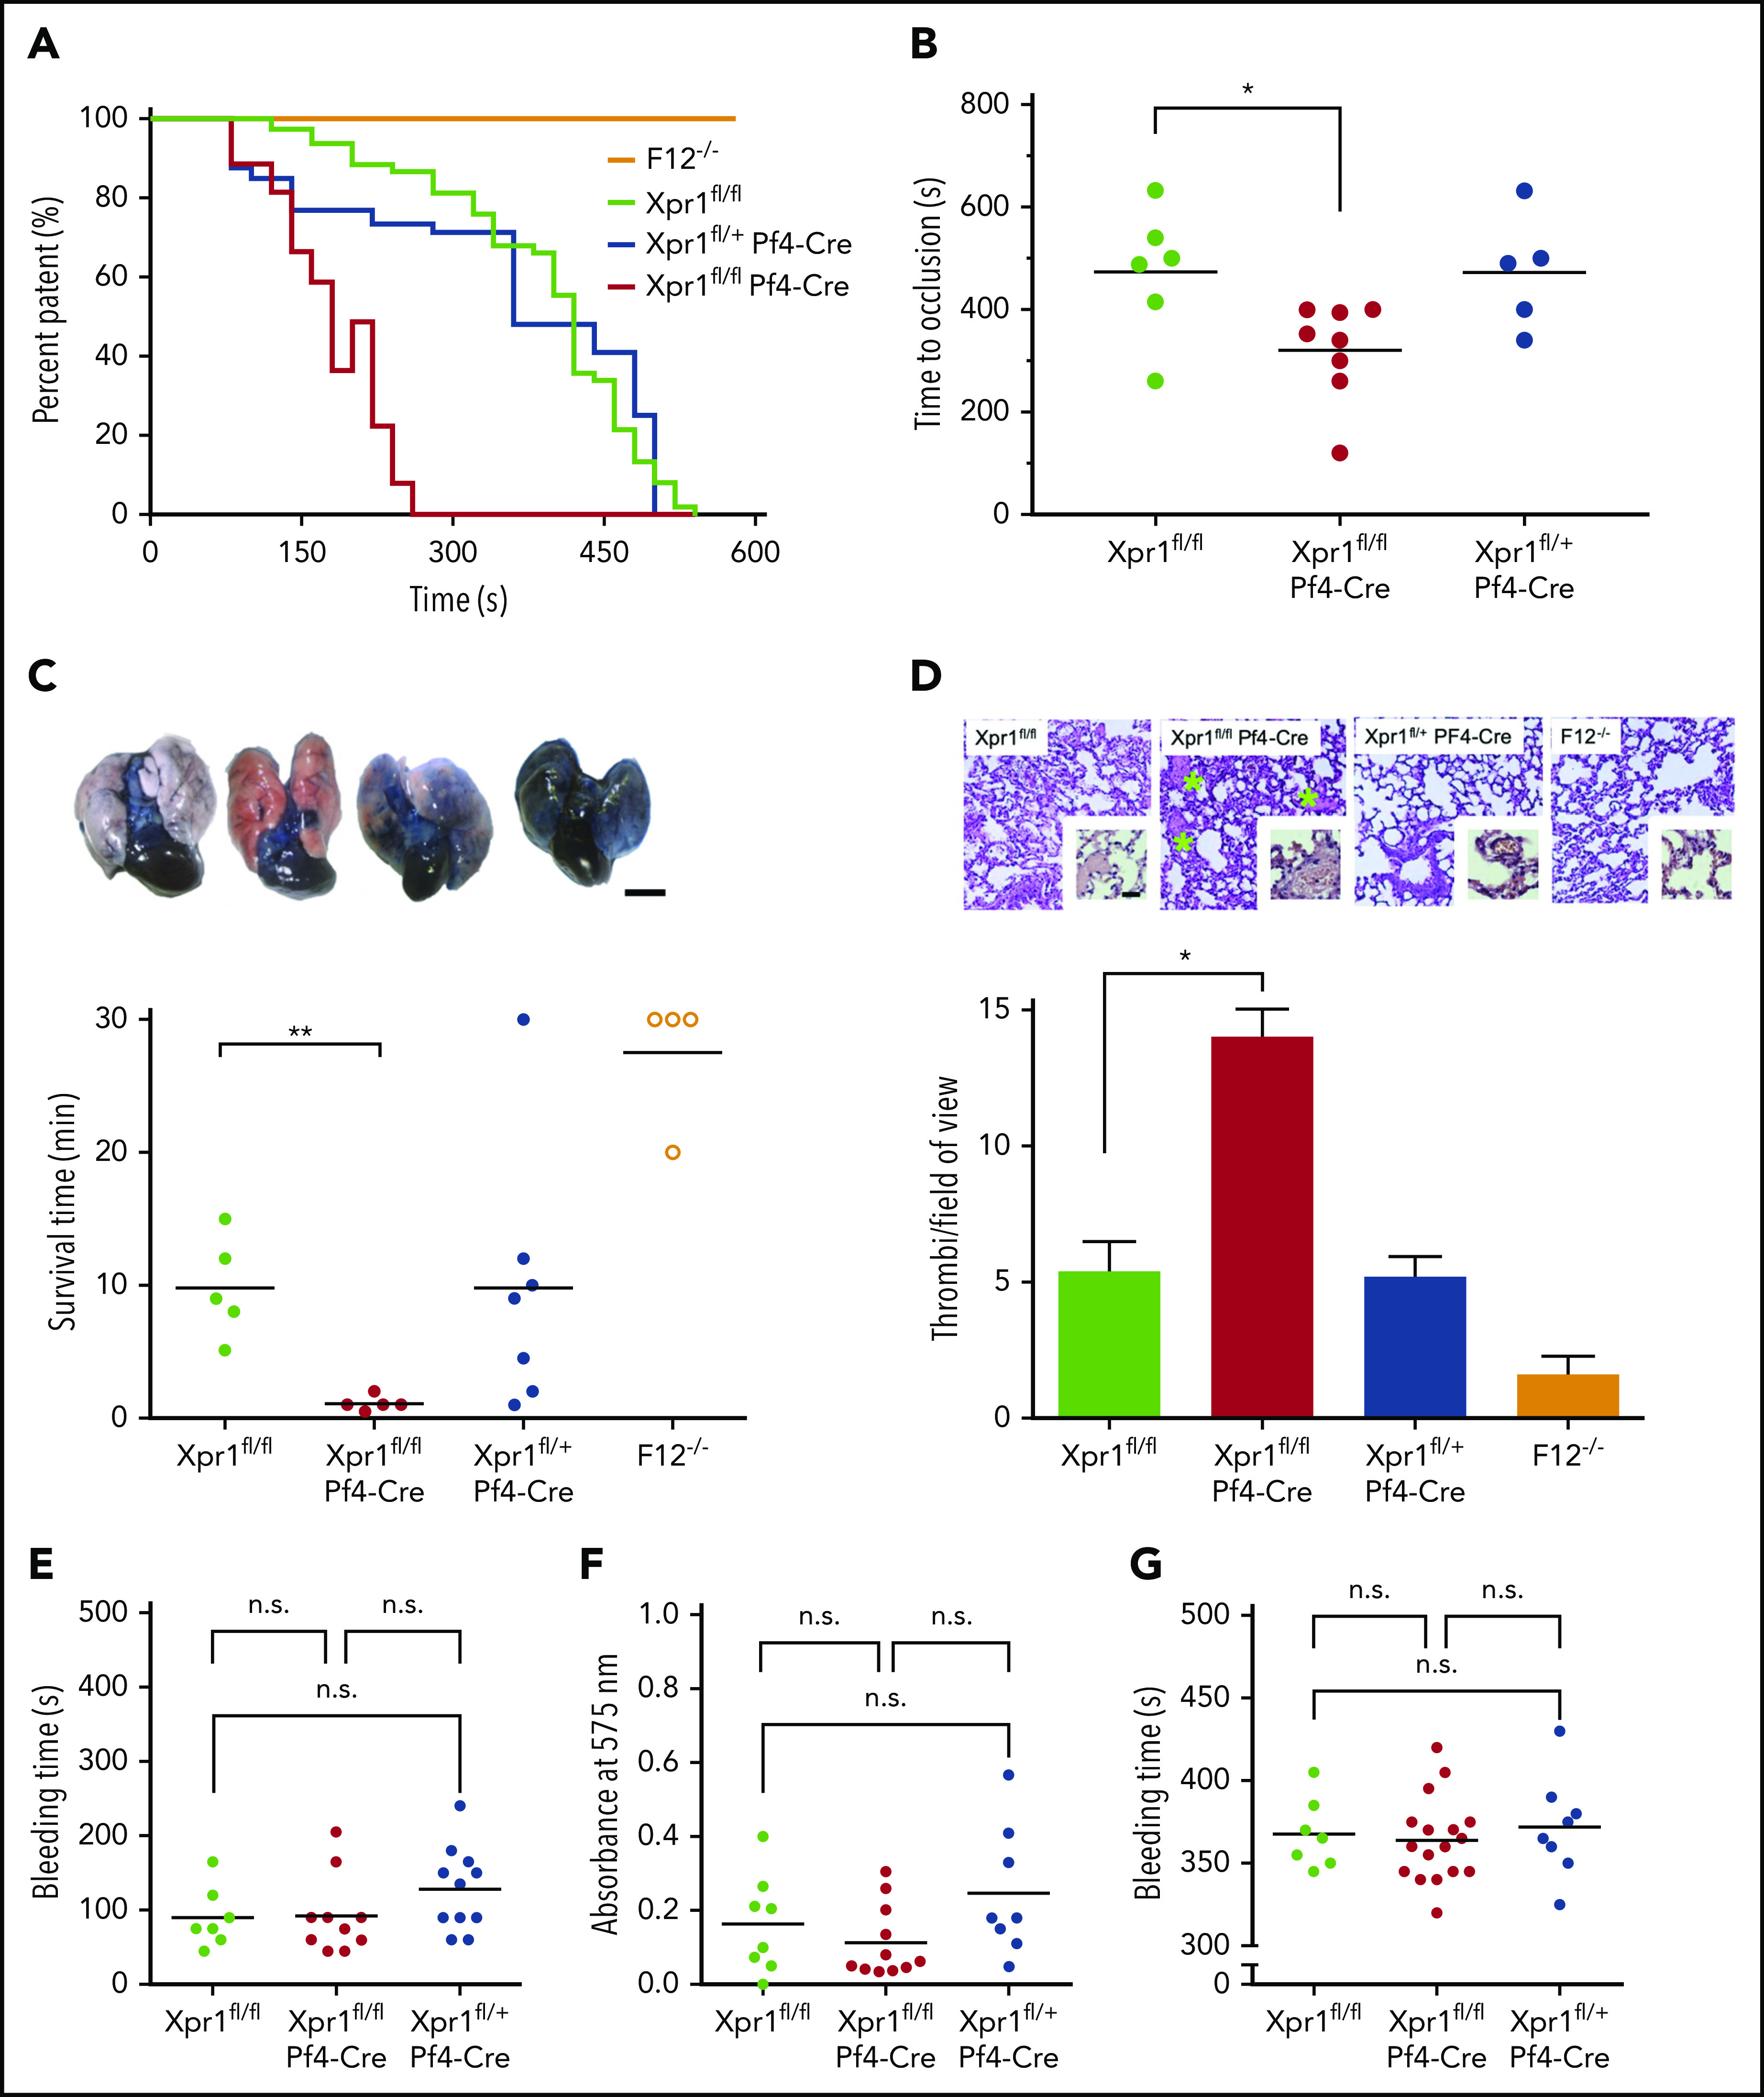
Polyphosphate is a procoagulant inorganic polymer of linear-linked orthophosphate residues. Multiple investigations have established the importance of platelet polyphosphate in blood coagulation; however, the mechanistic details of polyphosphate homeostasis in mammalian species remain largely undefined. In this study, xenotropic and polytropic retrovirus receptor 1 (XPR1) regulated polyphosphate in platelets and was implicated in thrombosis in vivo. We used bioinformatic analyses of omics data to identify XPR1 as a major phosphate transporter in platelets. XPR1 messenger RNA and protein expression inversely correlated with intracellular polyphosphate content and release. Pharmacological interference with XPR1 activity increased polyphosphate stores, led to enhanced platelet-driven coagulation, and amplified thrombus formation under flow via the polyphosphate/factor XII pathway. Conditional gene deletion of Xpr1 in platelets resulted in polyphosphate accumulation, accelerated arterial thrombosis, and augmented activated platelet-driven pulmonary embolism without increasing bleeding in mice. These data identify platelet XPR1 as an integral regulator of platelet polyphosphate metabolism and reveal a fundamental role for phosphate homeostasis in thrombosis.


Conflict of interest statement

Conflict-of-interest disclosure: The authors declare no competing financial interests.

Figures

None
Graphical abstract
Figure 1.
Figure 1.
XPR1 is a major phosphate transporter on platelets. (A) Data from the Human Protein Atlas project and GTEx Analysis V7 (https://gtexportal.org) were used to determine the expression of transcripts encoding for the 10 reported phosphate transporters in bone marrow and whole blood. Platelet Web (http://plateletweb.bioapps.biozentrum.uni-wuerzburg.de/plateletweb.php) and PubMed were used to establish whether protein expression on platelets had been described. TPM, transcripts per million. Cell membranes from the indicated number of human (B) or mouse (C) platelets were analyzed by western blot, using antibodies directed against the XPR1 N- or C-terminal portions. Lysed HEK293 cells transiently transfected with a pCHIX-XPR1–coding plasmid were loaded as a positive control (XPR1). (D) Bright-field image (left), confocal laser scanning image (middle; green) of XPR1 staining in nonpermeabilized resting human platelets, and merged image (right). Scale bar, 1 µm. (E) Transmission electron microscopy of immunogold-stained (10-nm particles) XPR1 on human platelets. Open canalicular system (OCS), dense tubular system (DTS), and α-granules are shown. Arrows indicate XPR1; scale bar, 100 nm.
Figure 2.
Figure 2.
XPR1 expression levels inversely correlate with polyP content in cells. HEK293 cells and MEG-01 megakaryocytes were transiently transfected with the indicated amounts of pCHIX-XPR1 or empty (Mock) vector. HEK293 (A) and MEG-01 (B) cells were analyzed by western blot with anti-XPR1 antibodies (top) after 24 and 48 hours, respectively. The cytoskeleton protein vasodilator-stimulated phosphoprotein (VASP) served as the loading control (bottom). XPR1 and polyP levels in XPR1-overexpressing HEK293 (C) and MEG-01 (D) cells. HEK293 (E) and MEG-01 (F) cells were transfected with 250 nM XPR1 siRNA and XPR1 mRNA expression and polyP were analyzed every 24 hours for 5 days. The expression of XPR1 mRNA was normalized to 18S rRNA signal and plotted, as a percentage of XPR1 expression at day 0 after control siRNA treatment (100%). Data are expressed as the mean ± standard error of the mean, by 1-way analysis of variance and Tukey’s multiple comparison test. *P < .05; **P < .01. PolyP from XPR1-overexpressing (OE) (G) or siRNA-treated XPR1 knockdown (KD) (H) cells was extracted, and equal amounts (10 ng per lane) of polyP were loaded, separated on polyacrylamide/urea gel, and visualized by negative DAPI staining. For the control, purified polyP was loaded before (−) or after (+) incubation with PPX (10 μg/ml for 1 hour).
Figure 3.
Figure 3.
Interference with XPR1 increases platelet polyP and promotes activated platelet-driven coagulation via the polyP/FXII pathway. (A-B) Washed human platelets were preincubated with XVDL (A), PVDL (B), or XVDL (200 μg/ml) and increasing PVDL concentrations (0-600 μg/ml) (C) for 1, 4, 8, or 24 hours. PolyP was measured as monophosphate with a malachite green assay. PolyP content before treatment was set to 100%. Analysis of released soluble polyP in the supernatant (D-E) and insoluble platelet membrane–associated polyP in collagen-stimulated (10 μg/ml) platelets (F-G) after a 4-hour incubation with XVDL and PVDL, respectively. PolyP was measured as in panel C. (H-I) Real-time thrombin formation in collagen-stimulated human PRP that was preincubated for 4 hours with XVDL or PVDL (2-200 μg/ml). Results are representative of 5 experiments. Endogenous thrombin potential (ETP) (J) and maximum (peak) thrombin (K) triggered in collagen-stimulated human PRP preincubated for 4 hours with XVDL (200 μg/ml) in the presence of PPX (500 μg/ml), PPX_Δ12 (500 μg/ml), 3F7 (650 nM), or infestin-4 (500 μg/ml). Data are expressed as the mean ± standard error of the mean; n = 3; *P < .05; **P < .01; n.s. nonsignificant.
Figure 4.
Figure 4.
Targeting XPR1 promotes thrombus formation in blood under flow. Citrated human whole-blood preincubated with XVDL (2-200 μg/ml; 4 hours) or PPX (2 mg/ml; 30 minutes) was readjusted to physiological Ca2+ and Mg2+ concentrations and perfused for 4 minutes over a collagen-coated surface at an arterial (1000 per second) (A) or venous (100 per second) (B) shear rate. Representative phase-contrast images (top) of thrombi formed during perfusion after incubation with the indicated XVDL concentrations. Scale bars, 10 µm. Bar graphs indicate the percentage of surface area covered by thrombi. Mean ± SD; n = 3. Comparisons were performed using 1-way analysis of variance and Tukey’s multiple comparison test; *P < .05, **P < .01. (C-D) Representative bright-field and immunofluorescence images of thrombi formed at t = 4 minutes under arterial (C) or venous (D) flow. Staining for fibrin (59D8; green) and platelets (GPIb; red) and merged images are shown. Scale bars, 10 μm. (E-F) Bright-field and immunofluorescence images of thrombi formed at t = 4 minutes under arterial (E) or venous (F) flow. Representative images of 6 individual experiments. Scale bars, 10 μm. PolyP signal (PPX_Δ12, green) was quantified from 4 randomly selected high-power images by ImageJ. **P < .01, by Student t test. RU, reflectance units.
Figure 5.
Figure 5.
PolyP is increased in platelet-specific XPR1-deficient mice. (A) Genotyping results of Xpr1fl/fl, Xpr1fl/+ Pf4-Cre, and Xpr1fl/fl Pf4-Cre mice. (B) Relative Xpr1 mRNA expression levels in megakaryocytes enriched from cultured bone marrow cells of Xpr1fl/fl and Xpr1fl/fl Pf4-Cre mice. (C) XPR1 signal in megakaryocyte-enriched bone marrow cell cultures of Xpr1fl/fl and Xpr1fl/fl Pf4-Cre mice measured by flow cytometry. SSC, side scatter. Percentages in the top right corner show the portion of gated cells. Megakaryocyte preparations derived from 2 (Xpr1fl/fl and Xpr1fl/fl Pf4-Cre) mice each analyzed for XPR1 content by western blot. β-Actin served as loading control (bottom). (D) Xpr1 mRNA expression in platelets of Xpr1fl/fl and Xpr1fl/fl Pf4-Cre mice. Xpr1 expression in Xpr1fl/fl platelets was set to 100%. (E) Plasma membranes isolated from 109 platelets of Xpr1fl/fl, Xpr1fl/fl Pf4-Cre, or Xpr1fl/+ Pf4-Cre mice were analyzed by western blot antibodies directed against the XPR1 N terminus. β-Actin served as the loading control. (F) Total polyP in platelets of Xpr1fl/fl, Xpr1fl/fl Pf4-Cre, or Xpr1fl/+ Pf4-Cre mice. Soluble polyP (G) and membrane-associated polyP (H) released by collagen-stimulated platelets measured as monophosphate in PPX-treated (50 μg/ml; 1 hour) platelet supernatants. Symbols represent individual mice. *P < .05, **P < .01, by 1-way analysis of variance and Tukey’s multiple comparison test. Platelet aggregation following activation by 1.5 µg/ml ristocetin (I) and 5 (J) or 10 (K) µg/ml collagen at 10 minutes. Transmission of suspended resting platelets is 0% and buffer, 100%. Student t test. n.s. nonsignificant.
Figure 6.
Figure 6.
Increased arterial and venous thrombosis but normal hemostasis in platelet XPR1-deficient mice. (A) Thrombus formation was induced in the left carotid artery by topical application of 5% FeCl3 for 3 minutes in F12−/−, Xpr1fl/fl, Xpr1fl/+ Pf4-Cre, and Xpr1fl/fl Pf4-Cre mice. Artery patency was monitored by a flow probe until complete occlusion occurred, and 0 flow was recorded for >10 minutes. Representative curves for 5 to 8 mice per genotype. (B) Time to complete carotid artery occlusion in the Xpr1fl/fl, Xpr1fl/fl Pf4-Cre, and Xpr1fl/+ Pf4-Cre mice from panel A. (C) PTE was induced by IV infusion of collagen and epinephrine in Xpr1fl/fl, Xpr1fl/fl Pf4-Cre, Xpr1fl/+ Pf4-Cre, and F12−/− mice. Shortly after the onset of respiratory arrest or at 30 minutes in mice that survived collagen-epinephrine treatment, Evans blue was infused IV while the heart was still beating. Occluded parts of the lungs remained their natural pinkish color. Lungs were excised, and perfusion defects were analyzed by impaired distribution of the dye in lung tissue (top), and survival time was assessed (bottom). Scale bar, 5 mm. (D) Hematoxylin and eosin–stained sections of lungs from Xpr1fl/fl, Xpr1fl/fl Pf4-Cre, Xpr1fl/+ Pf4-Cre, and F12−/− mice 30 minutes after collagen-epinephrine challenge (top). Green asterisks mark thrombi. Original magnification, ×10. The number of thrombi per visual field was counted in 6 mice (bottom). Data represent the mean ± standard deviation of 10 fields each. Scale bar, 100 µm. Bleeding times and blood loss from clipped tails assessed the hemostatic capacity of Xpr1fl/fl, Xpr1fl/fl Pf4-Cre, and Xpr1fl/+ Pf4-Cre mice. Bleeding time (E) and total hemoglobin loss (F), as determined by absorbance of hemoglobin in 37°C phosphate-buffered saline at λ = 575 nm. (G) Tail bleeding times were analyzed by gently adsorbing blood with a filter paper. Each symbol represents 1 animal; *P < .05; **P < .01; n.s. nonsignificant, by 1-way ANOVA and Tukey’s multiple comparison test.

Comment in

Similar articles

Cited by

References

    1. Rao NN, Gómez-García MR, Kornberg A. Inorganic polyphosphate: essential for growth and survival. Annu Rev Biochem. 2009;78(1):605-647. - PubMed
    1. Igor S, Kulaev VV. The Biochemistry of Inorganic Polyphosphates. 2nd ed. Chichester: John Wiley & Sons; 2004.
    1. Achbergerová L, Nahálka J. Polyphosphate–an ancient energy source and active metabolic regulator. Microb Cell Fact. 2011;10(1):63. - PMC - PubMed
    1. Xie L, Jakob U. Inorganic polyphosphate, a multifunctional polyanionic protein scaffold. J Biol Chem. 2019;294(6):2180-2190. - PMC - PubMed
    1. Secco D, Wang C, Shou H, Whelan J. Phosphate homeostasis in the yeast Saccharomyces cerevisiae, the key role of the SPX domain-containing proteins. FEBS Lett. 2012;586(4):289-295. - PubMed

Publication types