

Loss of TMEM106B potentiates lysosomal and FTLD-like pathology in progranulin-deficient mice
- PMID: 32929860
- PMCID: PMC7534633
- DOI: 10.15252/embr.202050241
Loss of TMEM106B potentiates lysosomal and FTLD-like pathology in progranulin-deficient mice
Abstract
Single nucleotide polymorphisms (SNPs) in TMEM106B encoding the lysosomal type II transmembrane protein 106B increase the risk for frontotemporal lobar degeneration (FTLD) of GRN (progranulin gene) mutation carriers. Currently, it is unclear if progranulin (PGRN) and TMEM106B are synergistically linked and if a gain or a loss of function of TMEM106B is responsible for the increased disease risk of patients with GRN haploinsufficiency. We therefore compare behavioral abnormalities, gene expression patterns, lysosomal activity, and TDP-43 pathology in single and double knockout animals. Grn-/- /Tmem106b-/- mice show a strongly reduced life span and massive motor deficits. Gene expression analysis reveals an upregulation of molecular signature characteristic for disease-associated microglia and autophagy. Dysregulation of maturation of lysosomal proteins as well as an accumulation of ubiquitinated proteins and widespread p62 deposition suggest that proteostasis is impaired. Moreover, while single Grn-/- knockouts only occasionally show TDP-43 pathology, the double knockout mice exhibit deposition of phosphorylated TDP-43. Thus, a loss of function of TMEM106B may enhance the risk for GRN-associated FTLD by reduced protein turnover in the lysosomal/autophagic system.
Keywords: FTD; TDP-43; TMEM106B; neurodegeneration; progranulin.
© 2020 The Authors. Published under the terms of the CC BY NC ND 4.0 license.
Conflict of interest statement
CH collaborates with Denali Therapeutics, participated on one advisory board meeting of Biogen, and received a speaker honorarium from Novartis and Roche. CH is chief advisor of ISAR Bioscience.
Figures
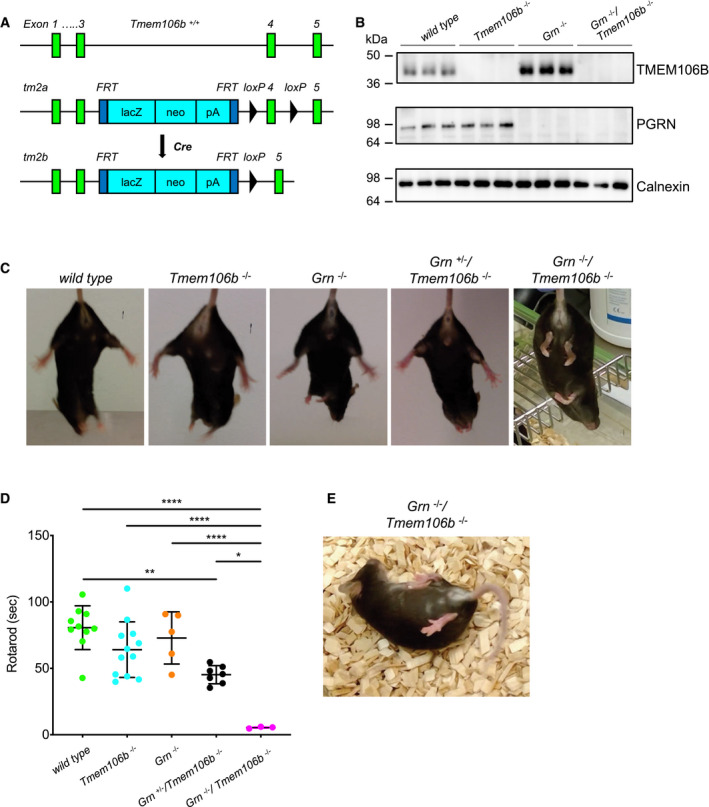
Schema of the mouse wild‐type and mutant Tmem106b locus. The tm2a allele carries a LacZ‐Neo selection cassette in intron 3 and a loxP‐flanked exon 4. Upon Cre recombinase expression in the germline, exon 4 is deleted and Tmem106b expression abolished (tm2b allele).
Western blot analysis of total brain lysates of wild‐type, Tmem106b −/− , Grn −/− and Grn −/−/Tmem106b −/− mice using antibody 6F2 to detect TMEM106B. (4.5‐month‐old mice with the given genotype; n = 3 biological replicates per genotype).
Hind limb clasping test wild‐type, Tmem106b −/− , Grn −/−, Grn +/−/Tmem106b −/− and Grn −/−/Tmem106b −/− mice. Representative pictures are shown of three mice analyzed for each genotype at 3 months of age.
Rotarod performance of wild‐type, Tmem106b −/− , Grn −/−, Grn +/−/Tmem106b −/− and double knockout animals at 3–4 months of age. Number of animals used for analysis, 10 wild‐type, 12 Tmem106b −/−, five Grn −/−, seven Grn +/−/Tmem106b −/−, three Grn −/−/Tmem106b −/− mice.
Representative picture of a 4.5‐month‐old double knockout (Grn −/−/Tmem106b −/−) mouse after manual flip.

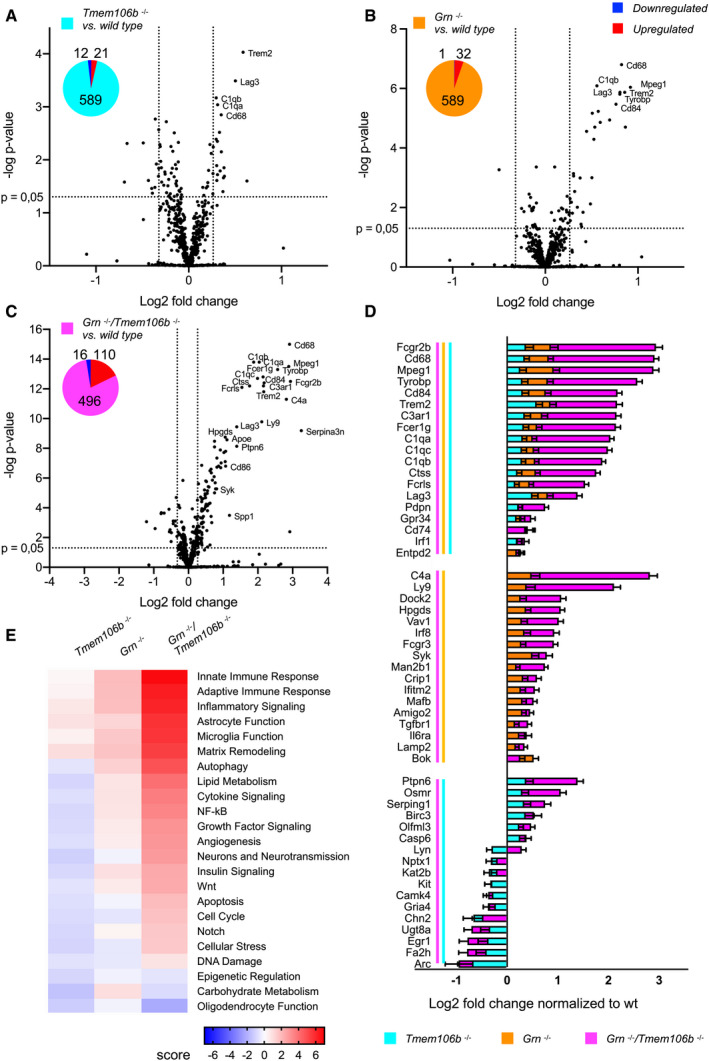
- A–C
Volcano plot of differentially expressed brain mRNAs of 4.5‐month‐old mice (n = 3 biological replicates per genotype) detected by the Neuropathology panel of NanoString. Expression changes were only taken into consideration when the extent of change was above 20% as indicated by vertical lines for all volcano plots. Gliosis‐ and myelination‐related genes are highlighted if changes are above 20%. Fold changes are displayed after log2 transformation. (A) Comparison of differentially expressed brain mRNAs from Tmem106b −/− and wild‐type mice. From 680 detected genes, 21 are significantly upregulated, while 10 are significantly reduced. (B) Comparison of Grn −/− and wild‐type mice. From 680 detected genes, 12 are significantly upregulated, while six are significantly reduced. (C) Volcano plot for Grn −/−/Tmem106b −/− and wild‐type mice. From 680 detected genes, 79 are significantly upregulated, while 24 are significantly reduced.
- D
Display of differently expressed genes overlapping between the analyzed genotypes from (A–C). Overlap was considered if a gene was significantly changed in the respective mouse models with more than 20% change in at least one mouse model. Note that nine genes are significantly altered in all three genotypes in comparison to the wild type. Seven genes are exclusively overlapping between the Grn −/− and the Grn −/−/Tmem106b −/− mice. Tmem106b −/− and Grn −/−/Tmem106b −/− mice share 15 significantly altered genes. Tmem106b −/− and Grn −/− mice share one significant altered gene. Data represent the mean ± SD.
- E
Gene set analysis based on NanoString advanced analysis R‐script included in the Neuropathology panel.
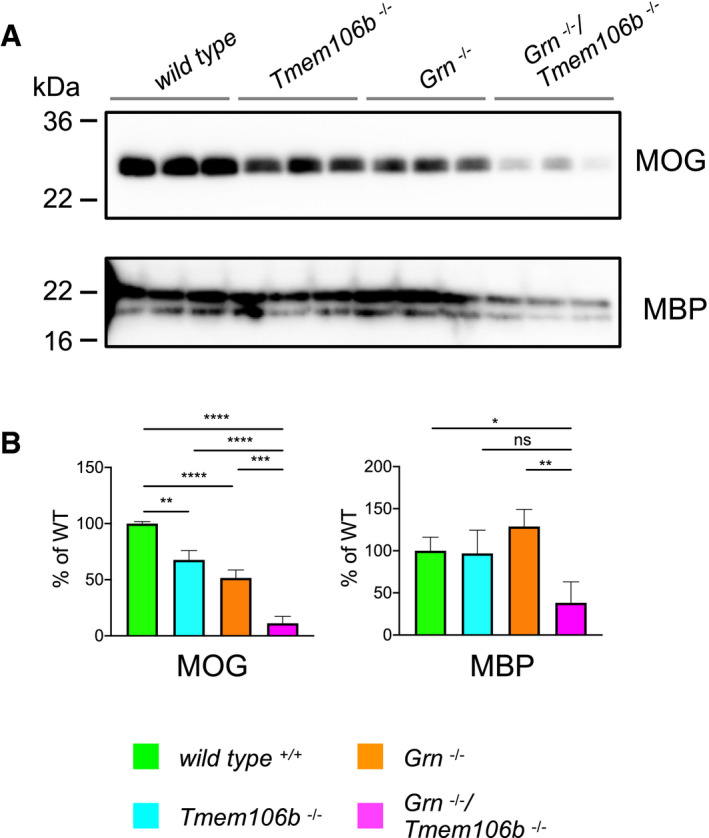
Western blot analysis of the myelin basic protein (MBP) and the myelin oligodendrocyte glycoprotein (MOG) in RIPA total brain lysates from 4.5‐month‐old mice with the indicated genotype (n = 3 biological replicates per genotype).
Quantification of (A). Protein expression was normalized to levels in wild‐type animals. Data represent the mean ± SD.
- A–C
Analysis of brain mRNA expression of 4.5‐month‐old mice (five wild‐type, four Grn −/−, four Tmem106b −/−, five Grn −/−/Tmem106b −/− mice) detected by the Neuroinflammation panel by NanoString. Expression changes were only taken into consideration when the extent of change was above 20% as indicated by vertical lines for in all volcano plots. Gliosis‐related genes are highlighted if changes are above 20%. Fold changes are displayed after log2 transformation. (A) Comparison of differentially expressed mRNA of Tmem106b −/− mice in comparison to wild‐type mice. From 622 detected genes, 21 are significantly upregulated, while 12 are significantly reduced. (B) Comparison of differentially expressed mRNA in Grn −/− and wild‐type mice. From 622 detected genes, 32 are significantly upregulated, while only one is significantly reduced. (C) Volcano plot of differentially expressed brain mRNAs from Grn −/−/Tmem106b −/− mice in comparison to wild‐type mice. From 622 detected genes, 110 are significantly upregulated, while 16 are significantly reduced.
- D
Display of differently expressed genes overlapping between the analyzed genotypes from (A–C). Overlap was considered if a gene was significantly changed in the respective mouse models with more than 20% change in at least one mouse model. Note that 19 genes are significantly altered in all three genotypes in comparison to the wild type. Seventeen genes are exclusively overlapping between the Grn −/− and the Grn −/−/Tmem106b −/− mice. Tmem106b −/− and Grn −/−/Tmem106b −/− mice share 17 significantly altered genes. Data represent the mean ± SD.
- E
Gene set analysis based on NanoString advanced analysis R‐script included in the Neuroinflammation panel.
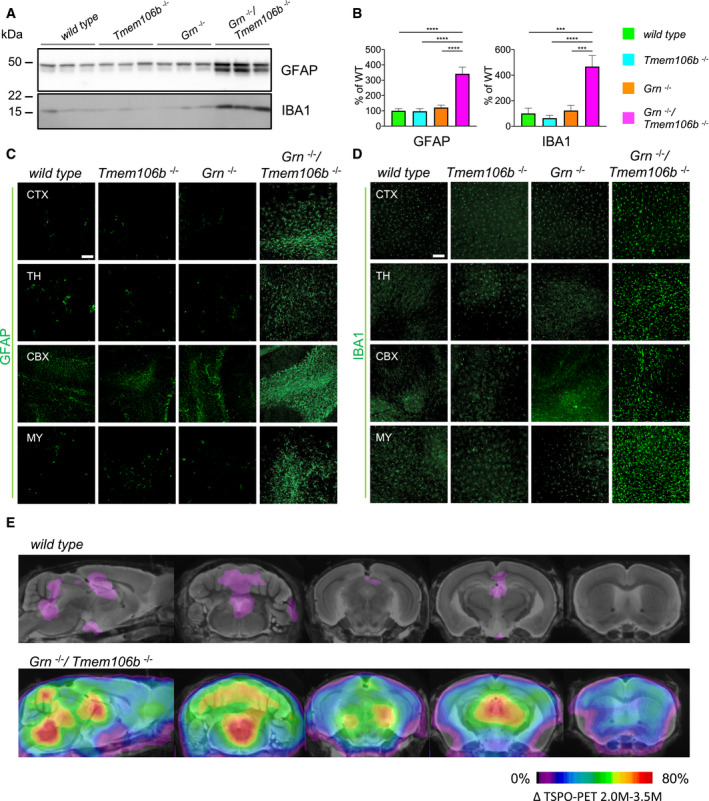
Western blot analysis of GFAP and IBA1 in total brain lysates from 4.5‐month‐old mice with the given genotype (n = 3 biological replicates per genotype).
Quantification of (A). Protein expression was normalized to levels in wild‐type animals. Data represent the mean ± SD.
Expression of GFAP in sagittal brain sections. Representative images of indicated brain regions (CBX, cerebellum; CTX, cortex; MY, medulla; TH, thalamus). Scale bar indicates 100 μm.
Expression of IBA1 in sagittal brain sections. Representative images of indicated brain regions (CBX, cerebellum; CTX, cortex; MY, medulla; TH, thalamus). Scale bar indicates 100 μm.
In vivo 18F‐GE180 TSPO μPET imaging. Two female Grn −/−/Tmem106b −/− and five female wild‐type mice underwent longitudinal TSPO μPET at 2.0 and 3.5 months of age. All analyses were performed by PMOD (V3.5, PMOD technologies). Normalization of injected activity was performed by the previously validated myocardium correction method.
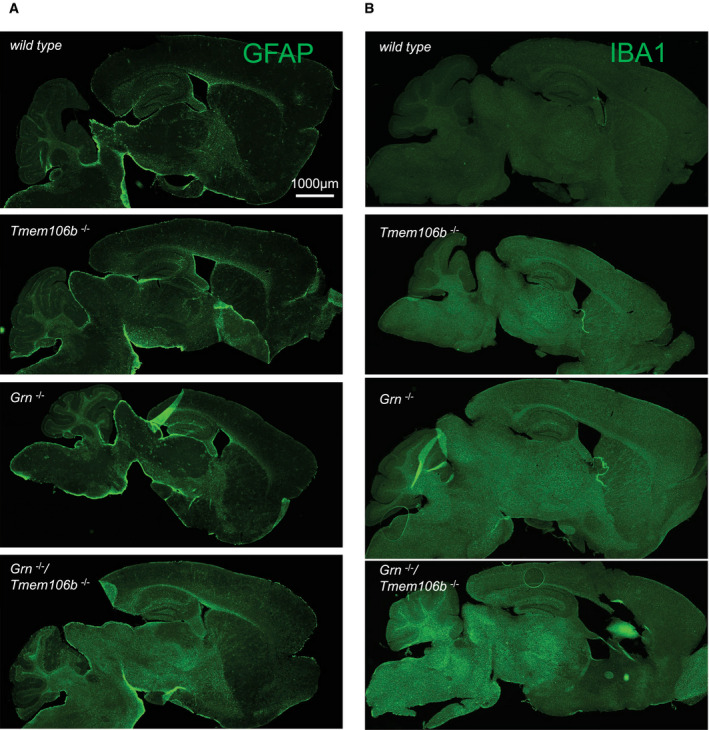
- A, B
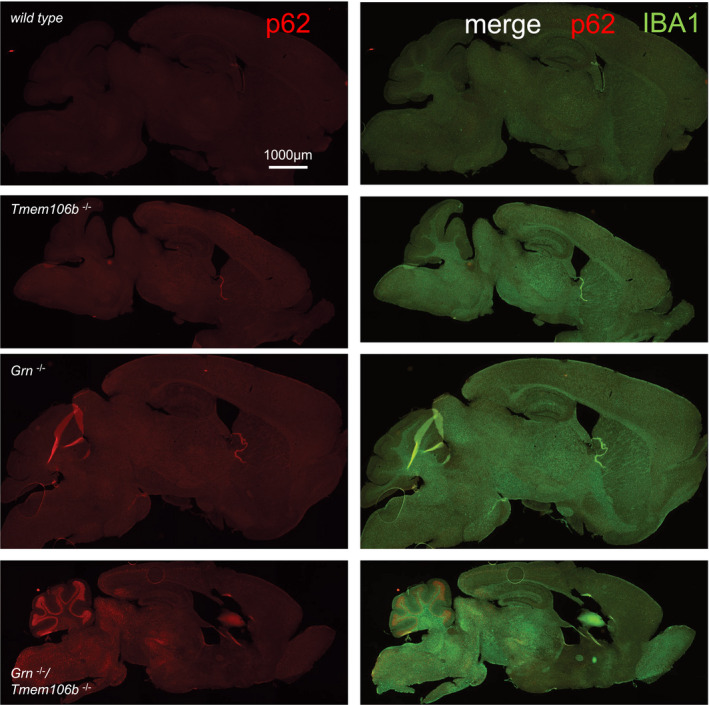
Gliosis analyzed by immunofluorescence staining of GFAP (A) and IBA1 (B) in sagittal brain sections. Whole brain section of 4.5‐month‐old mice, all genotypes acquired by same acquisition conditions. Scale bar indicates 1,000 μm.
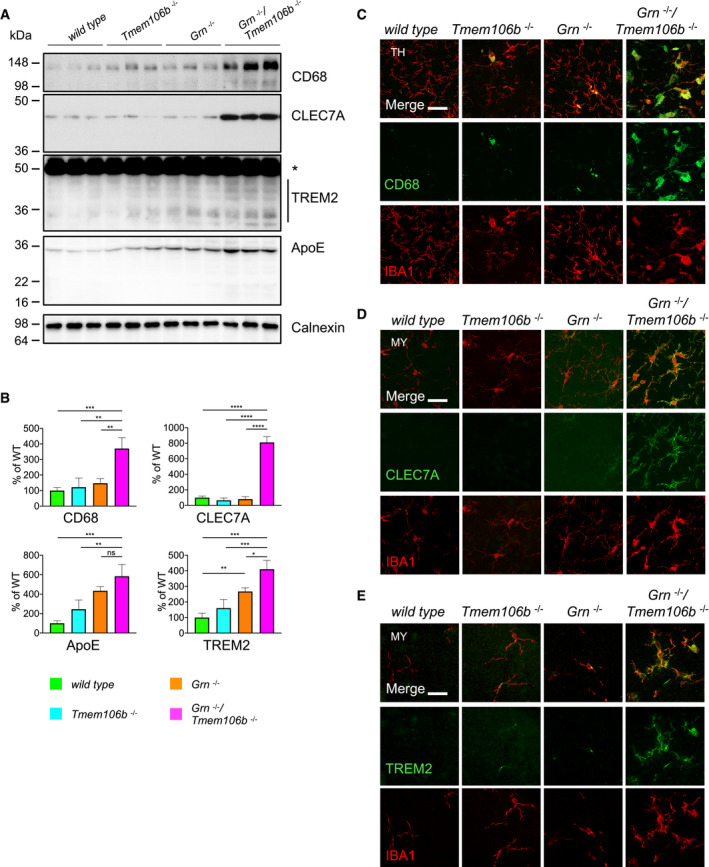
Western blot analysis of CD68, CLEC7A, TREM2, and ApoE in total brain lysates from 4.5‐month‐old mice with the given genotype. Asterisk indicates unspecific band (n = 3 biological replicates per genotype).
Quantification of (A). Protein expression was normalized to levels in wild‐type animals. Data represent the mean ± SD.
Expression of CD68 and the microglial marker IBA1 in sagittal brain sections. Representative images of indicated brain regions (TH, thalamus). Scale bar indicates 25 μm.
Expression of CLEC7A and the microglial marker IBA1 in sagittal brain sections. Representative images of indicated brain regions (MY, medulla). Scale bar indicates 25 μm.
Expression of TREM2 and the microglial marker IBA1 in sagittal brain sections. Representative images of indicated brain regions (MY, medulla). Scale bar indicates 25 μm.
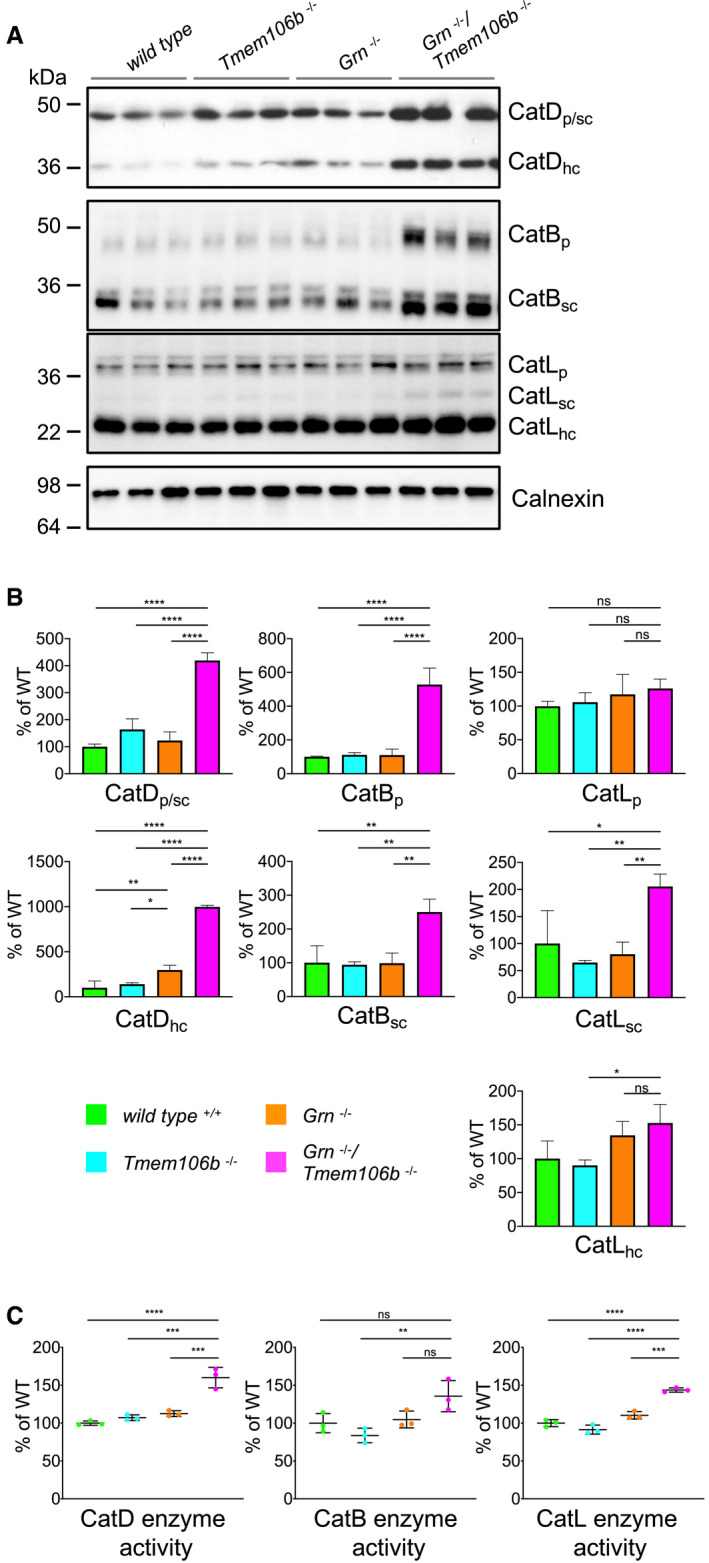
Western blot analysis of cathepsin (Cat) D, B, and L in total brain lysates from 4.5‐month‐old mice with the indicated genotype. Different maturation variants are indicated (hc, heavy chain; p, preform; sc, single chain; n = 3 biological replicates per genotype).
Quantification of proteolytically generated variants of cathepsin D, B, and L normalized to levels in wild‐type animals from (A). Data represent the mean ± SD.
Catalytic activity of cathepsin D, B, and L. Total brain lysates from 4.5‐month‐old mice were incubated with quenched fluorogenic substrate for Cat D, Cat B, and Cat L. The linear increase of fluorescence signal was measured and then normalized to wild type. Data represent the mean normalized activity ± SD (n = 3 biological replicates per genotype).
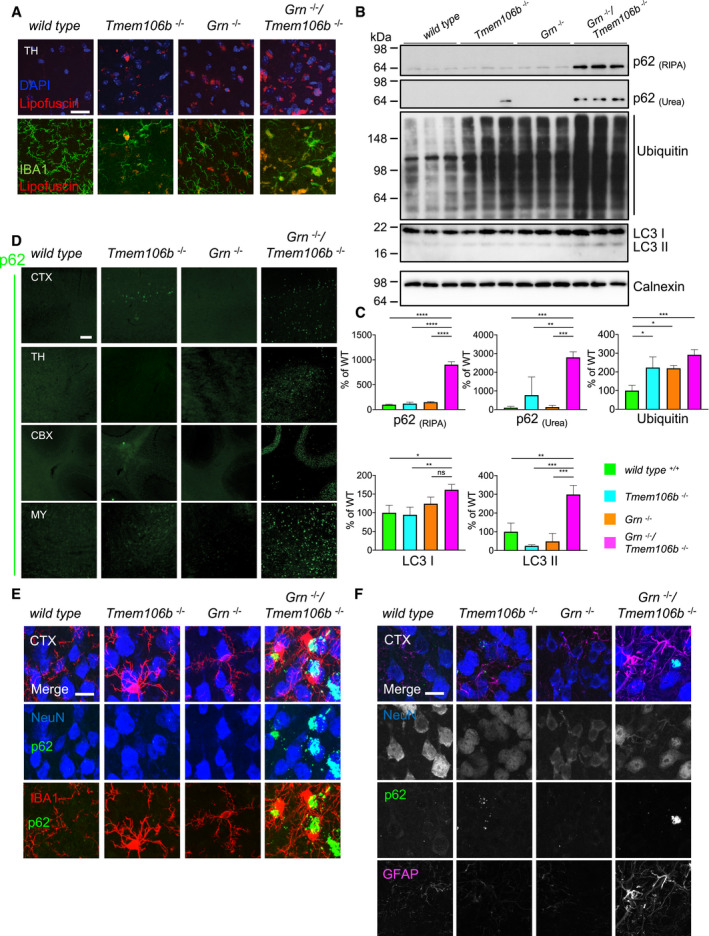
Immunofluorescence analysis of lipofuscin (red) and IBA1 (green) in sagittal brain sections. Representative images of the thalamus (TH). Scale bar indicates 25 μm.
Western blot analysis of ubiquitin and the autophagy marker LC3 in RIPA, and p62 in RIPA and urea total brain lysates from 4.5‐month‐old mice with the indicated genotype. Calnexin used as a loading control. (n = 3 biological replicates per genotype).
Quantification of (B). Protein expression was normalized to levels in wild‐type animals. Data represent the mean ± SD.
Immunofluorescence analysis of p62 in sagittal brain sections. Representative images of indicated brain regions (CBX, cerebellum; CTX, cortex; MY, medulla; TH, thalamus). Scale bar indicates 100 μm.
Localization of p62 mainly in NeuN‐positive cells in the cortex (CTX) of 4.5‐month‐old mice. Minor overlap of aggregates with microglial marker IBA1. Scale bar indicates 15 μm.
Complete overlap of co‐staining of p62 with NeuN in the cortex (CTX) and not with the reactive astrocyte marker GFAP. Scale bar indicates 15 μm.
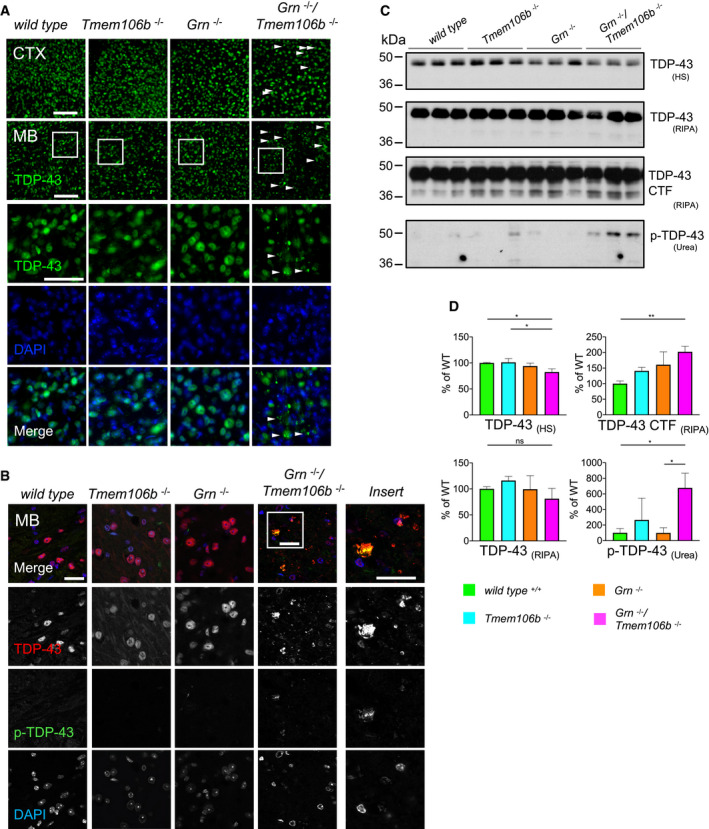
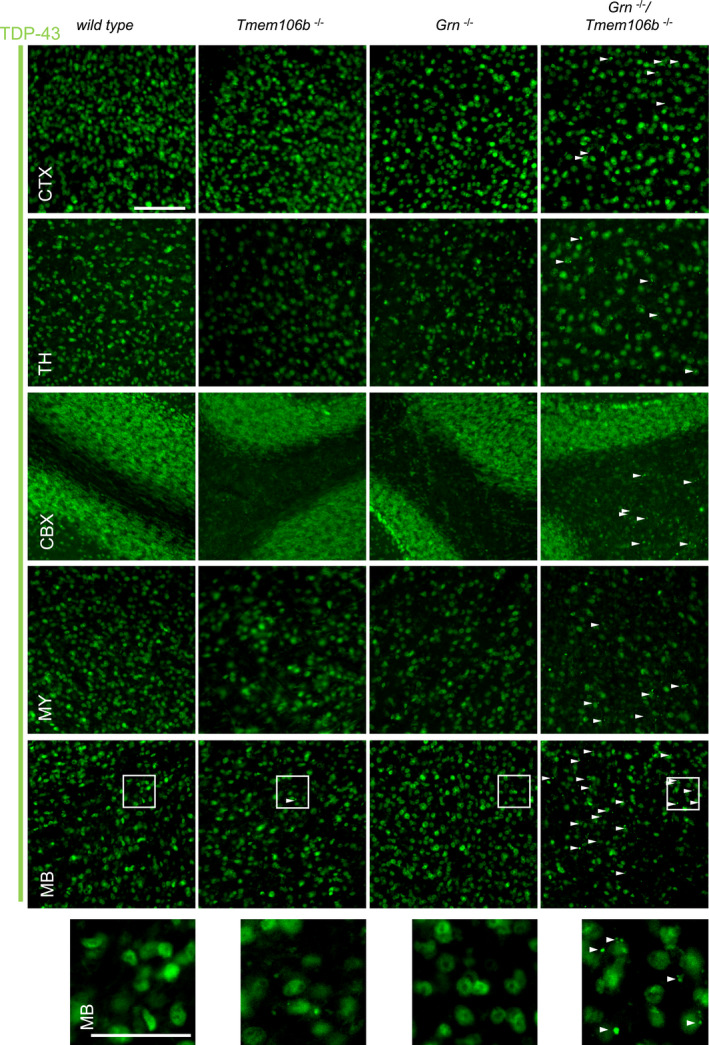
Immunofluorescence analysis of TDP‐43 in sagittal brain sections. Representative images of indicated brain regions (CTX, cortex; MB, midbrain). White arrow heads indicate TDP‐43 aggregation. Scale bar indicates 100 μm. Zoom in on TDP‐43 aggregation in double knockout mouse brain sections of the midbrain, scale bar zoom in indicates 50 μm (animals 4.5 months of age).
Immunofluorescence analysis of total TDP‐43 and phosphorylated TDP‐43 (p‐TDP-43) in sagittal brain sections by confocal microscopy. Representative images of one confocal layer in the midbrain. Zoom in on TDP‐43 aggregation in double knockout mouse brain sections of the midbrain. Scale bar indicates 25 μm (animals 4.5 months of age).
Western blot analysis of TDP‐43 and phosphorylated TDP‐43 (p‐TDP-43) in sequential high salt (HS)/RIPA/Urea fractionations of total brain lysates from 4.5‐month‐old mice with the indicated genotype. Analysis of C‐terminal fragments of TDP‐43 (CTF) in RIPA fraction. p‐TDP-43 analyzed in Urea fraction (n = 3 biological replicates per genotype).
Quantification of (C). Protein expression was normalized to levels in wild‐type animals. Data represent the mean ± SD.
Similar articles
-
Loss of Tmem106b exacerbates FTLD pathologies and causes motor deficits in progranulin-deficient mice.EMBO Rep. 2020 Oct 5;21(10):e50197. doi: 10.15252/embr.202050197. Epub 2020 Aug 5. EMBO Rep. 2020. PMID: 32761777 Free PMC article.
-
Partial Tmem106b reduction does not correct abnormalities due to progranulin haploinsufficiency.Mol Neurodegener. 2018 Jun 22;13(1):32. doi: 10.1186/s13024-018-0264-6. Mol Neurodegener. 2018. PMID: 29929528 Free PMC article.
-
Elevated TMEM106B levels exaggerate lipofuscin accumulation and lysosomal dysfunction in aged mice with progranulin deficiency.Acta Neuropathol Commun. 2017 Jan 26;5(1):9. doi: 10.1186/s40478-017-0412-1. Acta Neuropathol Commun. 2017. PMID: 28126008 Free PMC article.
-
Progranulin and TDP-43: mechanistic links and future directions.J Mol Neurosci. 2011 Nov;45(3):561-73. doi: 10.1007/s12031-011-9625-0. Epub 2011 Aug 24. J Mol Neurosci. 2011. PMID: 21863317 Free PMC article. Review.
-
The lysosomal function of progranulin, a guardian against neurodegeneration.Acta Neuropathol. 2018 Jul;136(1):1-17. doi: 10.1007/s00401-018-1861-8. Epub 2018 May 9. Acta Neuropathol. 2018. PMID: 29744576 Free PMC article. Review.
Cited by
-
Loss of TMEM106B and PGRN leads to severe lysosomal abnormalities and neurodegeneration in mice.EMBO Rep. 2020 Oct 5;21(10):e50219. doi: 10.15252/embr.202050219. Epub 2020 Aug 10. EMBO Rep. 2020. PMID: 32852886 Free PMC article.
-
CNS-wide repopulation by hematopoietic-derived microglia-like cells corrects progranulin deficiency in mice.Nat Commun. 2024 Jul 5;15(1):5654. doi: 10.1038/s41467-024-49908-4. Nat Commun. 2024. PMID: 38969669 Free PMC article.
-
The endolysosomal pathway and ALS/FTD.Trends Neurosci. 2023 Dec;46(12):1025-1041. doi: 10.1016/j.tins.2023.09.004. Epub 2023 Oct 10. Trends Neurosci. 2023. PMID: 37827960 Free PMC article. Review.
-
The major TMEM106B dementia risk allele affects TMEM106B protein levels, fibril formation, and myelin lipid homeostasis in the ageing human hippocampus.Mol Neurodegener. 2023 Sep 19;18(1):63. doi: 10.1186/s13024-023-00650-3. Mol Neurodegener. 2023. PMID: 37726834 Free PMC article.
-
Tweaking Progranulin Expression: Therapeutic Avenues and Opportunities.Front Mol Neurosci. 2021 Jul 23;14:713031. doi: 10.3389/fnmol.2021.713031. eCollection 2021. Front Mol Neurosci. 2021. PMID: 34366786 Free PMC article. Review.
References
-
- Almeida MR, Macario MC, Ramos L, Baldeiras I, Ribeiro MH, Santana I (2016) Portuguese family with the co‐occurrence of frontotemporal lobar degeneration and neuronal ceroid lipofuscinosis phenotypes due to progranulin gene mutation. Neurobiol Aging 41: 200.e201–200 - PubMed
-
- Baker M, Mackenzie IR, Pickering‐Brown SM, Gass J, Rademakers R, Lindholm C, Snowden J, Adamson J, Sadovnick AD, Rollinson S et al (2006) Mutations in progranulin cause tau‐negative frontotemporal dementia linked to chromosome 17. Nature 442: 916–919 - PubMed
-
- Bateman A, Cheung ST, Bennett HPJ (2018) A brief overview of progranulin in health and disease. Methods Mol Biol 1806: 3–15 - PubMed
Publication types
MeSH terms
Substances
Associated data
- Actions
- Actions
Grants and funding
LinkOut - more resources
Full Text Sources
Molecular Biology Databases
Miscellaneous
