. 2020 Jul 3;6(27):eaaz7809.
doi: 10.1126/sciadv.aaz7809. eCollection 2020 Jul.

Single-cell transcriptomics identifies multiple pathways underlying antitumor function of TCR- and CD8αβ-engineered human CD4+ T cells

Affiliations

Single-cell transcriptomics identifies multiple pathways underlying antitumor function of TCR- and CD8αβ-engineered human CD4+ T cells

Jan A Rath et al. Sci Adv. .

Abstract

Transgenic coexpression of a class I-restricted tumor antigen-specific T cell receptor (TCR) and CD8αβ (TCR8) redirects antigen specificity of CD4+ T cells. Reinforcement of biophysical properties and early TCR signaling explain how redirected CD4+ T cells recognize target cells, but the transcriptional basis for their acquired antitumor function remains elusive. We, therefore, interrogated redirected human CD4+ and CD8+ T cells by single-cell RNA sequencing and characterized them experimentally in bulk and single-cell assays and a mouse xenograft model. TCR8 expression enhanced CD8+ T cell function and preserved less differentiated CD4+ and CD8+ T cells after tumor challenge. TCR8+CD4+ T cells were most potent by activating multiple transcriptional programs associated with enhanced antitumor function. We found sustained activation of cytotoxicity, costimulation, oxidative phosphorylation- and proliferation-related genes, and simultaneously reduced differentiation and exhaustion. Our study identifies molecular features of TCR8 expression that can guide the development of enhanced immunotherapies.


Figures

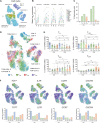
Fig. 1
Fig. 1. Coexpression of CD8αβ with TCR redirects CD4+ T cells to the targeted class I epitope.
(A) Scheme of retroviral vectors containing the survivin-specific TCR (top, TCR) or the combination of TCR and CD8αβ and the selectable marker gene ΔCD271 (bottom, TCR8). (B and C) Determination of monomeric dissociation kinetics with survivin-specific reversible NTAmers. (B) Representative analysis of temperature-controlled (4°C) pMHC-TCR or pMHC-TCR8 monomeric dissociation rates. No NTAmer staining in TCR+CD4+ T cells; ND, not detected. (C) Summary of monomeric dissociation constants [koff (s−1)], n = 3 donors, three independent experiments with technical replicates. Mean ± SD, P = NS, one-way analysis of variance (ANOVA) test. (D and E) Analysis of early TCR signaling events. (D) Representative FACS histograms of pLCK-Y394 phosphorylation NT (gray), TCR+ (blue), and TCR8+ (green) CD4+ or CD8+ T cells. (E) Summary of pLCK MFI normalized to MFI in NT control cells. n = 4 donors, mean ± SD, CD4: TCR+ versus TCR8+: 104 ± 11% versus 173 ± 35%, CD8: TCR+ versus TCR8+: 106 ± 7% versus 126 ± 13%, TCR8+ CD8 versus CD4: 126 ± 13% versus 173 ± 35%. NS, not significant, *P < 0.05. (F) Antigen sensitivity measured by IFN-γ ELISpot against peptide-pulsed T2 cells. SFC, spot-forming cells, n = 3 donors, three technical replicates each, mean ± SD, nonlinear regression (curve fit). (G) Coculture of NT, TCR+, or TCR8+ CD4+ (red bars) or CD8+ (black bars) T cells with BV173 leukemia cells (HLA-A2*02:01+survivin+); E:T ratio 1:5, residual BV173 cells quantified on day 3, n = 7. (H) Coculture of NT, TCR+, or TCR8+CD4+ (left) or CD8+ (right) T cells with wild-type (WT) BV173 (solid bars) or β2-microglobulin knockout (B2M-KO) BV173 cells (open bars); E:T ratio 1:5, residual BV173 cells quantified on day 3, n = 3. Mean ± SD, ***P < 0.001 and ****P < 0.0001. t test on log-transformed data.
Fig. 2
Fig. 2. Single-cell transcriptomics reveals distinct T cell subpopulations.
(A) Schematic overview of experimental setup and corresponding groups. (B) t-SNE plot of all 25,474 cells analyzed, color code indicates sample origin, and each dot represents one cell. (C) t-SNE plot of all cells separated into 19 distinct clusters by k-nearest neighbor clustering analysis; each cluster is color coded. (D) Heat map showing the top 20 DE genes of each cluster for all cocultured samples with selected genes identified on the right. Cluster 18 contains cocultured TCR+CD8+ and cocultured TCR8+CD8+ cells, depicted as clusters 18a and 18b on the heat map. (E) Venn diagram of DE genes (0.25 log fold change) up-regulated from expanded to cocultured state. Distinct or shared representative genes from each cocultured sample are indicated and color coded by biological function.
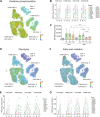
Fig. 3
Fig. 3. Sustained proliferative capacity and preservation of a less differentiated phenotype in cocultured TCR8+CD4+ T cells.
(A) t-SNE plot of cell cycle–associated genes (GO_0007049) revealing location of proliferating cells in each sample. (B) Mean expression pseudo time course of cell cycle–related genes for each sample. Pseudo time points represent fresh (F), expanded (E), and cocultured (C) conditions. (C) Bar plot representing proportion of replicating T cells per sample. The replicating cells are defined by their association to clusters 10, 13, 14, and 18. (D) t-SNE plot of TN, TCM, TEM, and TEFF cells identified by hierarchical clustering. Each dot represents one cell color coded by differentiation status. (E) Combined plot overlaying % cells for each subset by t-SNE (bars) and two-marker–based FACS validation (line with dots, CD62L and CD45RO, n = 9 independent donors, mean ± SD and individual values, Mann-Whitney U test). *P < 0.05, **P < 0.01, ***P < 0.001, and ****P < 0.0001. (F) t-SNE plot (top) and corresponding bar plot (bottom) showing mean gene expression of representative TN/TCM markers TCF7, IL7R, CCR7, and CXCR4.
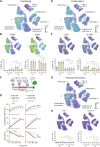
Fig. 4
Fig. 4. TCR8 promotes cytotoxicity and costimulation in TCR8+CD4+ T cells in the absence of exceeding activation/exhaustion.
(A) t-SNE plot of cytotoxicity-related genes (list of genes provided in table S3). (B) t-SNE plot of GZMB and GZMA (top) and intracellular FACS validation of T cells stimulated with BV173 cells (bottom, n = 6 independent donors, mean ± SD and individual values, Mann-Whitney U test). **P < 0.01. (C) Single-cell quantification of interaction kinetics between T cells and target cells by TIMING assay. tSeek, time to first encounter of effector and target cell; tContact, time of conjugation between effector and target cell; tDeath, time from first contact to target cell apoptosis. (D) Cumulative incidence of a single T cell in finding (tSeek) one (left, E:T 1:1) or two (right, E:T 1:2) target cells (top row), in forming a stable synapse with the target (tContact, middle row), or in killing the target (tDeath). TCR+CD4+ T cells (red dotted lines), TCR8+CD4+ T cells (red solid lines), TCR+CD8+ T cells (black dotted lines), and TCR8+CD8+ T cells (black solid lines). *P < 0.05, **P < 0.01, ***P < 0.001, and ****P < 0.0001, log-rank test. (E) t-SNE plot of costimulation-related genes (list of genes provided in table S3). (F) t-SNE plot of CD28 and SLAMF1 (top) and FACS validation (bottom, n = 6 to 9 independent donors, mean ± SD and individual values, Mann-Whitney U test). *P < 0.05, ***P < 0.001, and ****P < 0.0001. (G) t-SNE plot of activation/exhaustion related-genes (list of genes provided in table S3). (H) t-SNE plot of PD-1 and CTLA-4 (top) and FACS validation (bottom, n = 5 independent donors, mean ± SD and individual values, Mann-Whitney U test).
Fig. 5
Fig. 5. TCR8+CD4+ T cells are characterized by metabolic programs that support enhanced T cell performance.
(A) t-SNE plot of OXPHOS-related genes [HUGO Gene Nomenclature Committee (HGNC) database group 639, four to five representative genes per complex]. (B) Mean expression pseudo time course of representative OXPHOS genes. (C) Absolute MFI values for mitochondrial membrane potential (left) and mass (right) determined by FACS (n = 7 to 8 independent donors, mean ± SD and individual values, Mann-Whitney U test). *P < 0.05 and ***P < 0.001. (D) t-SNE plot of glycolysis-related genes (KEGG database). (E) Mean expression pseudo time course of indicated genes. (F) t-SNE plot of FAO-related genes (KEGG database). (G) Mean expression pseudo time course of indicated genes.
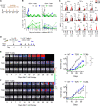
Fig. 6
Fig. 6. TCR8+CD4+ T cells efficiently kill and expand under stress conditions in vitro and in vivo.
(A) Experimental setup of bulk sequential coculture stress test. (B) Sequential cocultures of CD4+ (left) or CD8+ (right) T cells. Quantification of tumor (top) and T cells (bottom) over time, with tumor cell rechallenge (+), n = 7. Number of tumor cell killings by condition: CD4+ T cells: NT 0 ± 0, TCR+ 0 ± 0, TCR8+ 3.2 ± 0.5; CD8+ T cells: NT 0 ± 0, TCR+ 1.3 ± 1.1, TCR8+ 2 ± 1.4. TCR+CD8+ versus TCR8+CD8+ T cells: P = 0.04; TCR8+CD4+ versus TCR+CD8+ T cells: P = 0.01; TCR8+CD4+ versus TCR8+CD8+ T cells: P = NS, t test. T cell expansion: TCR+CD8+ versus TCR8+CD8+: P = NS; TCR8+CD4+ versus TCR+CD8+: P = 0.002; TCR8+CD4+ versus TCR8+CD8+, P = 0.015, t test on log AUC. (C) Cytokine quantification in coculture supernatants 24 hours after first tumor challenge (D1) and 24 hours after third tumor challenge (D10), n = 6. Mean ± SD, *P < 0.05 and **P < 0.01. (D) Experimental setup mouse xenograft experiment. XRT, radiation; BLI, bioluminescence imaging; iv, intravenously. (E and F) BLI results from mice treated with (E) CD8+ T cells or (F) CD4+ T cells. BLI pictures show three representative mice per group, color scale 5 × 10³ to 5 ×10⁴ p/sec/cm2/sr (left) and summary of total flux (right). Nontransduced (NT) control T cells (n = 5, gray), TCR+ T cells (n = 5, blue), TCR8+ T cells (n = 5, green). Mean ± SD. **P < 0.01, ***P < 0.001, and ****P < 0.0001. t test on log AUC, day 28 for CD8+, day 35 for CD4+ T cells.
Fig. 7
Fig. 7. TCR8+CD4+ T cell performance is characterized by sustained expression of diverse transcriptional programs.
(A) Summary of the main findings identified by scRNAseq in cocultured cytotoxic engineered CD4+ and CD8+ T cells. (B) Summary of main findings from in vitro and in vivo functional assays and overall engineered T cell performance. Low to high intensity of red indicates low to high T cell function.

Similar articles

Cited by

References

    1. Morris E. C., Tsallios A., Bendle G. M., Xue S.-A., Stauss H. J., A critical role of T cell antigen receptor-transduced MHC class I-restricted helper T cells in tumor protection. Proc. Natl. Acad. Sci. U.S.A. 102, 7934–7939 (2005). - PMC - PubMed
    1. Kessels H. W., Schepers K., van den Boom M. D., Topham D. J., Schumacher T. N., Generation of T cell help through a MHC class I-restricted TCR. J. Immunol. 177, 976–982 (2006). - PubMed
    1. Frankel T. L., Burns W. R., Peng P. D., Yu Z., Chinnasamy D., Wargo J. A., Zheng Z., Restifo N. P., Rosenberg S. A., Morgan R. A., Both CD4 and CD8 T cells mediate equally effective in vivo tumor treatment when engineered with a highly avid TCR targeting tyrosinase. J. Immunol. 184, 5988–5998 (2010). - PMC - PubMed
    1. Xue S.-A., Gao L., Ahmadi M., Ghorashian S., Barros R. D., Pospori C., Holler A., Wright G., Thomas S., Topp M., Morris E. C., Stauss H. J., Human MHC Class I-restricted high avidity CD4+ T cells generated by co-transfer of TCR and CD8 mediate efficient tumor rejection in vivo. Oncoimmunology 2, e22590 (2013). - PMC - PubMed
    1. van Loenen M. M., Hagedoorn R. S., de Boer R., Falkenburg J. H., Heemskerk M. H., Extracellular domains of CD8α and CD8ß subunits are sufficient for HLA class I restricted helper functions of TCR-engineered CD4+ T cells. PLOS ONE 8, e65212 (2013). - PMC - PubMed

Publication types