

Waveguide-based surface-enhanced Raman spectroscopy detection of protease activity using non-natural aromatic amino acids
- PMID: 32923079
- PMCID: PMC7449744
- DOI: 10.1364/BOE.398038
Waveguide-based surface-enhanced Raman spectroscopy detection of protease activity using non-natural aromatic amino acids
Abstract
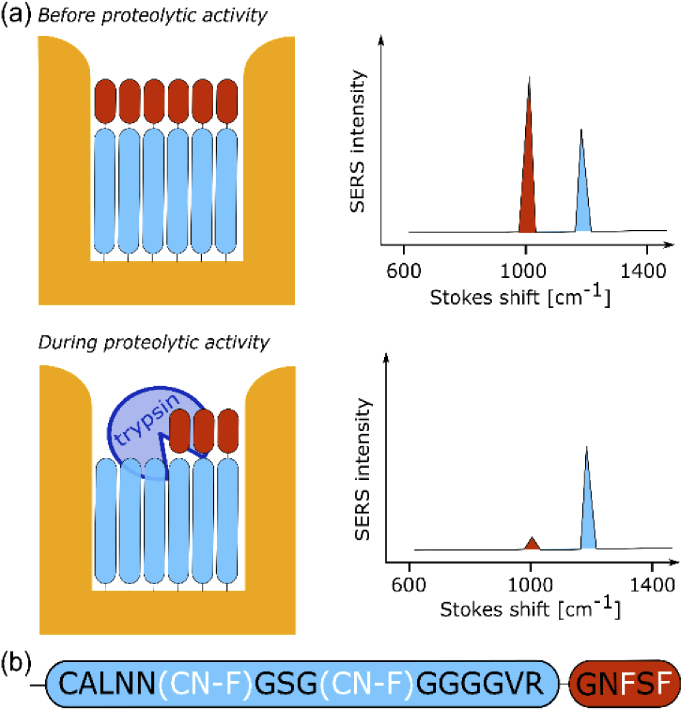
Surface enhanced Raman spectroscopy (SERS) is a selective and sensitive technique, which allows for the detection of protease activity by monitoring the cleavage of peptide substrates. Commonly used free-space based SERS substrates, however, require the use of bulky and expensive instrumentation, limiting their use to laboratory environments. An integrated photonics approach aims to implement various free-space optical components to a reliable, mass-reproducible and cheap photonic chip. We here demonstrate integrated SERS detection of trypsin activity using a nanoplasmonic slot waveguide as a waveguide-based SERS substrate. Despite the continuously improving SERS performance of the waveguide-based SERS substrates, they currently still do not reach the SERS enhancements of free-space substrates. To mitigate this, we developed an improved peptide substrate in which we incorporated the non-natural aromatic amino acid 4-cyano-phenylalanine, which provides a high intrinsic SERS signal. The use of non-natural aromatics is expected to extend the possibilities for multiplexing measurements, where the activity of several proteases can be detected simultaneously.
© 2020 Optical Society of America under the terms of the OSA Open Access Publishing Agreement.
Conflict of interest statement
The authors declare no competing financial interest.
Figures

Similar articles
-
Comparison of Free-Space and Waveguide-Based SERS Platforms.Nanomaterials (Basel). 2019 Oct 1;9(10):1401. doi: 10.3390/nano9101401. Nanomaterials (Basel). 2019. PMID: 31581547 Free PMC article.
-
Gold nanodome SERS platform for label-free detection of protease activity.Faraday Discuss. 2017 Dec 4;205:345-361. doi: 10.1039/c7fd00124j. Faraday Discuss. 2017. PMID: 28920115
-
Hybrid plasmonic grating slot waveguide with high field enhancement for an on-chip surface-enhanced Raman scattering sensor.Appl Opt. 2020 Jan 20;59(3):748-755. doi: 10.1364/AO.383198. Appl Opt. 2020. PMID: 32225205
-
Waveguide Enhanced Raman Spectroscopy for Biosensing: A Review.ACS Sens. 2021 Jun 25;6(6):2025-2045. doi: 10.1021/acssensors.1c00366. Epub 2021 Jun 11. ACS Sens. 2021. PMID: 34114813 Review.
-
Applied surface enhanced Raman Spectroscopy in plant hormones detection, annexation of advanced technologies: A review.Talanta. 2022 Jan 1;236:122823. doi: 10.1016/j.talanta.2021.122823. Epub 2021 Aug 25. Talanta. 2022. PMID: 34635213 Review.
Cited by
-
Translation of a Protease Turnover Assay for Clinical Discrimination of Mucinous Pancreatic Cysts.Diagnostics (Basel). 2022 May 28;12(6):1343. doi: 10.3390/diagnostics12061343. Diagnostics (Basel). 2022. PMID: 35741154 Free PMC article.
-
Waveguide-Enhanced Raman Spectroscopy (WERS): An Emerging Chip-Based Tool for Chemical and Biological Sensing.Sensors (Basel). 2022 Nov 22;22(23):9058. doi: 10.3390/s22239058. Sensors (Basel). 2022. PMID: 36501760 Free PMC article. Review.
-
Non-Canonical Amino Acids in Analyses of Protease Structure and Function.Int J Mol Sci. 2023 Sep 13;24(18):14035. doi: 10.3390/ijms241814035. Int J Mol Sci. 2023. PMID: 37762340 Free PMC article. Review.
References
LinkOut - more resources
Full Text Sources
Miscellaneous