

Transcriptome Analyses in BV2 Microglial Cells Following Treatment With Amino-Terminal Fragments of Apolipoprotein E
- PMID: 32922284
- PMCID: PMC7456952
- DOI: 10.3389/fnagi.2020.00256
Transcriptome Analyses in BV2 Microglial Cells Following Treatment With Amino-Terminal Fragments of Apolipoprotein E
Abstract
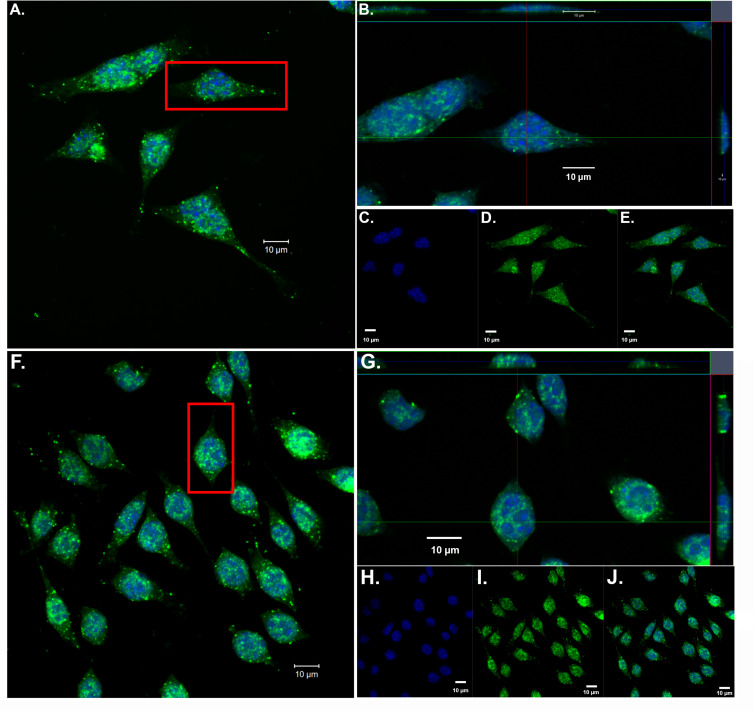
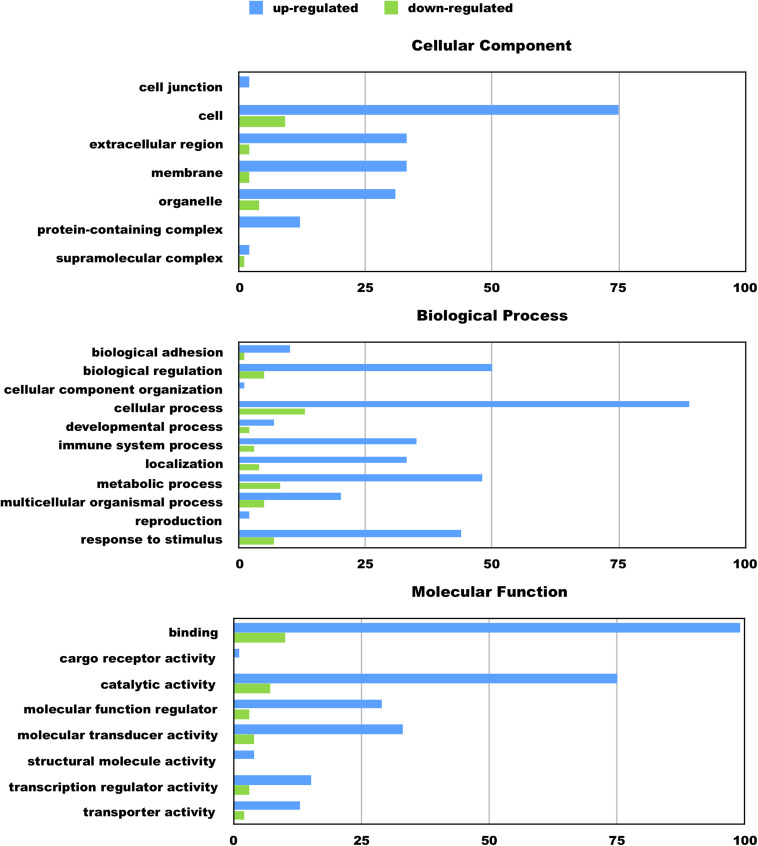
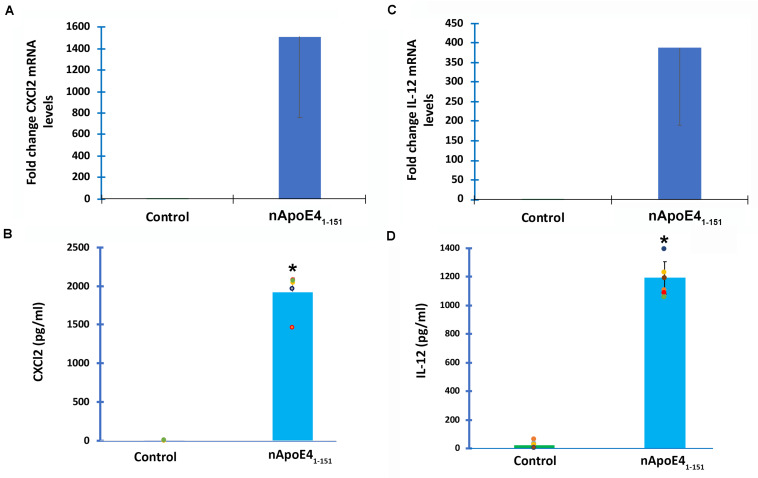
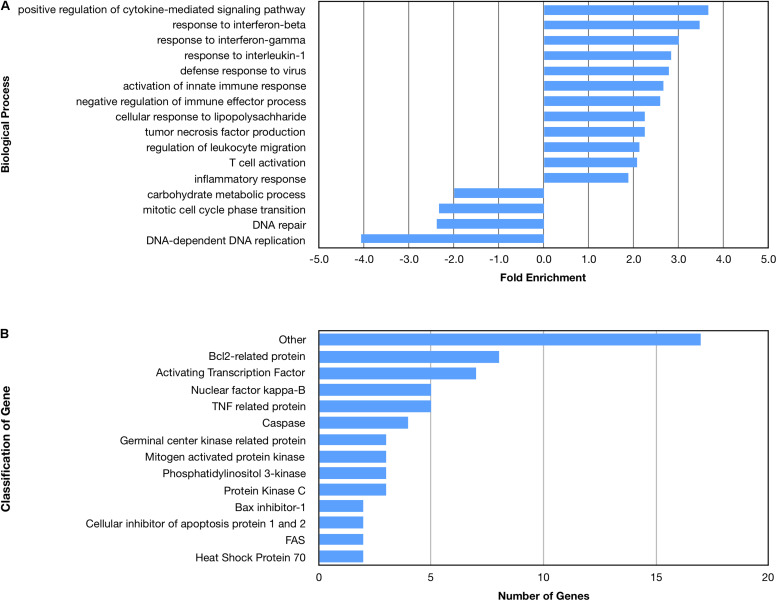
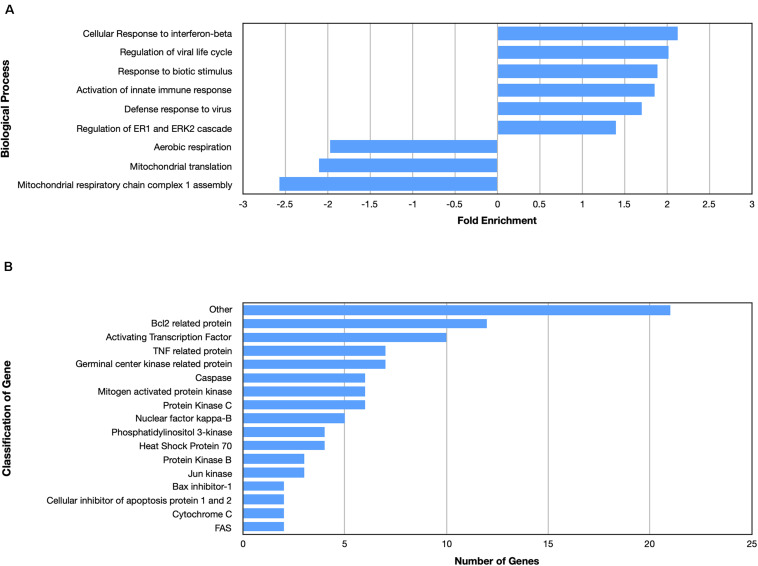
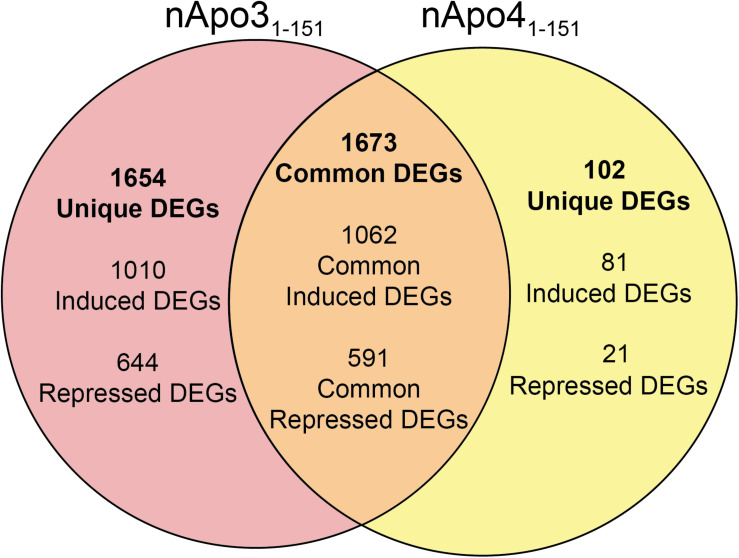
Despite the fact that harboring the apolipoprotein E4 (APOE4) allele represents the single greatest risk factor for late-onset Alzheimer's disease (AD), the exact mechanism by which ApoE4 contributes to disease progression remains unknown. Recently, we demonstrated that a 151 amino-terminal fragment of ApoE4 (nApoE41-151) localizes within the nucleus of microglia in the human AD brain and traffics to the nucleus causing toxicity in BV2 microglia cells. In the present study, we examined in detail what genes may be affected following treatment by nApoE41-151. Transcriptome analyses in BV2 microglial cells following sublethal treatment with nApoE41-151 revealed the upregulation of almost 4,000 genes, with 20 of these genes upregulated 182- to 715-fold compared to untreated control cells. The majority of these 20 genes play a role in the immune response and polarization toward microglial M1 activation. As a control, an identical nApoE31-151 fragment that differed by a single amino acid at position 112 (Cys→Arg) was tested and produced a similar albeit lower level of upregulation of an identical set of genes. In this manner, enriched pathways upregulated by nApoE31-151 and nApoE41-151 following exogenous treatment included Toll receptor signaling, chemokine/cytokine signaling and apoptosis signaling. There were unique genes differentially expressed by at least two-fold for either fragment. For nApoE31-151, these included 16 times as many genes, many of which are involved in physiological functions within microglia. For nApoE41-151, on the other hand the number genes uniquely upregulated was significantly lower, with many of the top upregulated genes having unknown functions. Taken together, our results suggest that while nApoE31-151 may serve a more physiological role in microglia, nApoE41-151 may activate genes that contribute to disease inflammation associated with AD. These data support the hypothesis that the link between harboring the APOE4 allele and dementia risk could be enhanced inflammation through activation of microglia.
Keywords: Alzheimer’s disease; BV2 cells; M1 phenotype; RNA-seq; apolipoprotein E4; inflammation; microglia cells; toxicity.
Copyright © 2020 Pollock, Cholico, Isho, Day, Suresh, Stewart, McCarthy and Rohn.
Figures

Similar articles
-
Fragmentation of Apolipoprotein E4 is Required for Differential Expression of Inflammation and Activation Related Genes in Microglia Cells.Int J Neurodegener Dis. 2021;4(1):020. doi: 10.23937/2643-4539/1710020. Epub 2021 Sep 10. Int J Neurodegener Dis. 2021. PMID: 34693295 Free PMC article.
-
An amino-terminal fragment of apolipoprotein E4 leads to behavioral deficits, increased PHF-1 immunoreactivity, and mortality in zebrafish.PLoS One. 2022 Dec 15;17(12):e0271707. doi: 10.1371/journal.pone.0271707. eCollection 2022. PLoS One. 2022. PMID: 36520946 Free PMC article.
-
A Fragment of Apolipoprotein E4 Leads to the Downregulation of a CXorf56 Homologue, a Novel ER-Associated Protein, and Activation of BV2 Microglial Cells.Oxid Med Cell Longev. 2019 May 6;2019:5123565. doi: 10.1155/2019/5123565. eCollection 2019. Oxid Med Cell Longev. 2019. PMID: 31198491 Free PMC article.
-
The Role of APOE4 in Disrupting the Homeostatic Functions of Astrocytes and Microglia in Aging and Alzheimer's Disease.Front Aging Neurosci. 2019 Feb 11;11:14. doi: 10.3389/fnagi.2019.00014. eCollection 2019. Front Aging Neurosci. 2019. PMID: 30804776 Free PMC article. Review.
-
Microglial polarization: novel therapeutic mechanism against Alzheimer's disease.Inflammopharmacology. 2020 Feb;28(1):95-110. doi: 10.1007/s10787-019-00613-5. Epub 2019 Jul 1. Inflammopharmacology. 2020. PMID: 31264132 Review.
Cited by
-
FoxO1 Controls Redox Regulation and Cellular Physiology of BV-2 Microglial Cells.Inflammation. 2023 Apr;46(2):752-762. doi: 10.1007/s10753-022-01771-5. Epub 2022 Dec 14. Inflammation. 2023. PMID: 36515788
-
Modelling Microglial Innate Immune Memory In Vitro: Understanding the Role of Aerobic Glycolysis in Innate Immune Memory.Int J Mol Sci. 2023 May 18;24(10):8967. doi: 10.3390/ijms24108967. Int J Mol Sci. 2023. PMID: 37240311 Free PMC article.
-
Fragmentation of Apolipoprotein E4 is Required for Differential Expression of Inflammation and Activation Related Genes in Microglia Cells.Int J Neurodegener Dis. 2021;4(1):020. doi: 10.23937/2643-4539/1710020. Epub 2021 Sep 10. Int J Neurodegener Dis. 2021. PMID: 34693295 Free PMC article.
-
An amino-terminal fragment of apolipoprotein E4 leads to behavioral deficits, increased PHF-1 immunoreactivity, and mortality in zebrafish.PLoS One. 2022 Dec 15;17(12):e0271707. doi: 10.1371/journal.pone.0271707. eCollection 2022. PLoS One. 2022. PMID: 36520946 Free PMC article.
-
Histone deacetylase 3 regulates microglial function through histone deacetylation.Epigenetics. 2023 Dec;18(1):2241008. doi: 10.1080/15592294.2023.2241008. Epigenetics. 2023. PMID: 37506371 Free PMC article.
References
Grants and funding
LinkOut - more resources
Full Text Sources
Molecular Biology Databases
Research Materials