. 2020 Sep 23;11(3):286-299.e4.
doi: 10.1016/j.cels.2020.08.008. Epub 2020 Sep 10.

Cell Mechanics at the Rear Act to Steer the Direction of Cell Migration

Affiliations

Cell Mechanics at the Rear Act to Steer the Direction of Cell Migration

Greg M Allen et al. Cell Syst. .

Abstract

Motile cells navigate complex environments by changing their direction of travel, generating left-right asymmetries in their mechanical subsystems to physically turn. Currently, little is known about how external directional cues are propagated along the length scale of the whole cell and integrated with its force-generating apparatus to steer migration mechanically. We examine the mechanics of spontaneous cell turning in fish epidermal keratocytes and find that the mechanical asymmetries responsible for turning behavior predominate at the rear of the cell, where there is asymmetric centripetal actin flow. Using experimental perturbations, we identify two linked feedback loops connecting myosin II contractility, adhesion strength and actin network flow in turning cells that are sufficient to explain the observed cell shapes and trajectories. Notably, asymmetries in actin polymerization at the cell leading edge play only a minor role in the mechanics of cell turning-that is, cells steer from the rear.

Keywords: actin; adhesion; asymmetry; cell migration; cell motility; cell turning; keratocyte; myosin; self-organization.


Conflict of interest statement

Declaration of Interests The authors declare no competing interests.

Figures

Figure 1.
Figure 1.. Long-term trajectories of single cells exhibit persistent turning states.
(A) Example trajectories of 6 keratocytes cells over a time scale of ~10 hours. Trajectories start at blue dots, and each color represents a different cell. Arrowheads indicate the current direction of motion every 20 minutes and are colored from blue/start to red/finish. Scale bar indicates distance traveled. Note cells can exhibit two phases of migration with long periods of persistent turning intermixed with periods of straighter paths. (B) Example trajectory of a cell exhibiting prolonged periods of persistent turning (cell-7, magenta, top) and a cell following a wandering path (cell-8, gold, bottom). Scale in micrometers. (C) Time series of angular velocity, (ω), for cell-7 (magenta) and cell-8 (gold). (D) Auto-correlation of angular velocity (A(ω)) as a function of lag time in minutes for cell-7 (magenta), cell-8 (gold) and average of all 38 cells (black). (E) Distribution of angular velocities for the persistently turning cell-7 (magenta, top) and the wandering cell-8 (gold, bottom).
Figure 2.
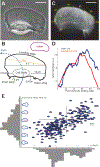
Figure 2.. Turning cells have asymmetric shapes and F-actin distributions.
(A) Example phase-contrast image of a cell in an asymmetric circular path turning counter-clockwise. Scale bars in all panels are 10 μm. (B) The contour of this cell illustrating the cell path (blue line) as well as the elongated aspect ratio on the outer side of the turning cell. The cell body is displaced towards the inside of the turn, and the outer wing lags behind the cell. The leading edge orientation (orange line) is orthogonal to the direction that the cell was previously traveling previously (dashed orange line) and the rear edge orientation (green line) is orthogonal to the direction the cell is currently traveling. The inset contour shows the average shape of 22 mutually aligned turning cells. (C) F-actin distribution from this turning cell as visualized by AF-488 phalloidin labeling, with yellow numbers indicating position along the leading edge. (D) Measured density of F-actin along the points of the leading edge of the cell in panel C (blue line) and in the average of a population of 10 turning cells (red line). Note the asymmetric accumulation of actin filaments at the leading edge on the outer side. (E) For a single cell that is being forced to turn at a high rate by exposure to multiple external electric fields over 272 time points over approximately 20 minutes, the angular velocity at each time point, ω, is plotted against the left-right asymmetric PCA shape mode (Keren et al., 2008) as depicted on the vertical axis. The distribution of values for both asymmetric shape and angular velocity are plotted in grey adjacent to each axis. Calculated correlation coefficient is 0.73, calibration bar for cell outline images is 100 μm.
Figure 3.
Figure 3.. Asymmetric myosin activity drives persistent cell turning
(A) A sample image of myosin regulatory light chain-YFP distribution in a turning cell with a counter-clockwise path (magenta line). Note that the myosin II density is higher on the outer side of the turning cell. (B) Time series of the myosin density in the outer wing, mo (green), and inner wing, mi (orange), of the cell from panel A, showing consistently higher myosin on the outer side of this turning cell over time. Note that the vertical axis does not start at 0. (C) The relative concentration of myosin II heavy chain as determined by immunofluorescence on the outer and inner sides of cells that were imaged live prior to fixation (vertical axis), plotted against the cell’s path curvature prior to fixation (horizontal axis). Note that cells with a greater degree of turning had an increase in the asymmetry of myosin II localization, correlation coefficient is 0.67 for 15 cells. (D) The distribution of calculated auto-correlation of angular velocity with a lag of 10 minutes was calculated for control cells (left/blue) and cells treated with the myosin-II inhibitor blebbistatin (right/orange). Inhibition of myosin-II drastically reduced the number of cells exhibiting persistent turns. (E) The trajectories of cells exposed to an electric field of 5 V/cm under control conditions (top) and with inhibition of myosin II (bottom). All cells migrate towards the cathode on the right, but only cells under control conditions have a periodic overshoot of a straight trajectory suggestive of persistence of a previous angular velocity.
Figure 4.
Figure 4.. Asymmetric centripetal actin network flow in turning cells produces an asymmetric myosin distribution.
Experimentally determined vector maps representing fluorescence speckle microscopy measurements of the flow of the F-actin network in the cell frame of reference (A) and in the lab or substrate frame of reference (B) for a cell turning counter-clockwise. Results are representative of measurements made in 12 separate cells. Graphical depictions of each frame of reference are presented in insets. Scale bar indicates 5 μm, and vector arrow size and color scales with magnitude of flow speed.
Figure 5.
Figure 5.. Turning cells apply asymmetric traction forces.
(A) Vector maps of average experimentally measured traction forces created by a cell migrating along a straight path (left) and a cell turning counterclockwise (right). Scale bar presented below is in microns. (B) Time series of the spatial average of the inward component of traction forces on the left (red) and right (blue) sides of the same cells as in panel C. Note that turning cells have persistently higher inward traction forces on the inside of the turn when compared to the outside, which matches simulations performed with higher adhesion strength on the inside of a turning cell. (C) Time series of the spatial average of the forward component of traction forces on the left (green) and right (black) sides of the same cells. Note that turning cells have persistently higher forward traction forces on the outer side of the turning cell when compared to the inner side, again matching simulations with left-right adhesion asymmetry.
Figure 6.
Figure 6.. Myosin or adhesion asymmetry is sufficient to induce turning.
(A) The trajectories of a set of cells that were asymmetrically exposed to calyculin locally on the left side of the cell during the portion of the trajectory marked in red. Local calyculin exposure induced cells to turn away from the side of upregulated myosin II activity. Trajectories start at squares and proceed from left to right. Each color indicates a different cell. (B) Images of a single cell crossing a boundary between a 2% RGD normal adhesion substrate (light) on to a 0.04% RGD low adhesion substrate (dark), causing the cell to turn toward the high adhesion side of the cell when adhesion at the rear becomes unbalanced. Scale bar indicates 10 μm. (C) Trajectories of a set of cells crossing a boundary of normal adhesion density (2% RGD) to low adhesion density (0.04% RGD) on the bottom and from low adhesion density to normal adhesion density on the top. Start positions are marked with small squares, dashed lines indicate trajectories after hitting boundary. All trajectories are centered on the boundary collision point marked with circle. Cells either reflect off the adhesion boundary or refract towards the side of higher adhesion, where the change in direction is dependent on the incident angle with the boundary. Scale bar on bottom indicates distance in microns.
Figure 7.
Figure 7.. Schematic of mechanical actions underpinning cell turning.
A mechanical model of cell turning in keratocytes. (left panel) The act of turning creates the “centrifugal” accumulation of myosin bound to the actin filaments to the outer side of the cell. (center panel) Myosin accumulation on the outer side of a turning cell, increases local myosin contractility and the centripetal flow of actin slipping over the substrate on the outer side of the cell driving turning. Typical actin meshwork flow from the substrate’s frame of reference is shown. Positive connectors indicate positive feedback between asymmetric actin flow and myosin accumulation. (right panel) Increased myosin contractility and actin flow on the outer side of the turning cell breaks adhesions on the outer edge of the cell (SLIP), weak traction forces (colored vectors) and further promoting the centripetal sliding of the outer actin network over the substrate and consequently turning. Conversely, STICK conditions on the inner side of a turning cell, create strong adhesion and large traction forces. Pinching traction forces perpendicular to the direction of movement are asymmetric. Traction forces at the leading edge are propulsive, and at the rear – resistive. Thus, the elevated contractility and flow on the outer edge inhibit the formation of strong adhesion on the outer edge, which would otherwise inhibit turning (Negative connectors indicate double negative feedback between asymmetric actin flow and adhesion strength). The traction forces and asymmetric adhesions are explained further in Box 1.

Similar articles

Cited by

References

    1. Allen GM, Mogilner A, and Theriot JA (2013). Electrophoresis of cellular membrane components creates the directional cue guiding keratocyte galvanotaxis. Curr Biol 23, 560–568. - PMC - PubMed
    1. Arrieumerlou C, and Meyer T (2005). A local coupling model and compass parameter for eukaryotic chemotaxis. Dev Cell 8, 215–227. - PubMed
    1. Barnhart E, Lee K-C, Allen GM, Theriot JA, and Mogilner A (2015). Balance between cell-substrate adhesion and myosin contraction determines the frequency of motility initiation in fish keratocytes. Proc. Natl. Acad. Sci. U. S. A 112, 5045–5050. - PMC - PubMed
    1. Barnhart EL, Lee K-C, Keren K, Mogilner A, and Theriot JA (2011). An Adhesion-Dependent Switch between Mechanisms That Determine Motile Cell Shape. PLoS Biol 9, e1001059. - PMC - PubMed
    1. Berg HC, and Brown DA (1972). Chemotaxis in Escherichia coli analysed by three-dimensional tracking. Nature 239, 500–504. - PubMed

Publication types

LinkOut - more resources