. 2020 Sep 30;40(40):7625-7636.
doi: 10.1523/JNEUROSCI.0125-20.2020. Epub 2020 Sep 10.

The Secreted Glycoprotein Reelin Suppresses the Proliferation and Regulates the Distribution of Oligodendrocyte Progenitor Cells in the Embryonic Neocortex

Affiliations

The Secreted Glycoprotein Reelin Suppresses the Proliferation and Regulates the Distribution of Oligodendrocyte Progenitor Cells in the Embryonic Neocortex

Himari Ogino et al. J Neurosci. .

Abstract

Oligodendrocyte (OL) progenitor cells (OPCs) are generated, proliferate, migrate, and differentiate in the developing brain. Although the development of OPCs is prerequisite for normal brain function, the molecular mechanisms regulating their development in the neocortex are not fully understood. Several molecules regulate the tangential distribution of OPCs in the developing neocortex, but the cue molecule(s) that regulate their radial distribution remains unknown. Here, we demonstrate that the secreted glycoprotein Reelin suppresses the proliferation of OPCs and acts as a repellent for their migration in vitro These functions rely on the binding of Reelin to its receptors and on the signal transduction involving the intracellular protein Dab1. In the late embryonic neocortex of mice with attenuated Reelin signaling [i.e., Reelin heterozygote-deficient, Dab1 heterozygote-deficient mutant, or very low-density lipoprotein receptor (VLDLR)-deficient mice], the number of OPCs increased and their distribution shifted toward the superficial layers. In contrast, the number of OPCs decreased and they tended to distribute in the deep layers in the neocortex of mice with abrogated inactivation of Reelin by proteolytic cleavage, namely a disintegrin and metalloproteinase with thrombospondin type 1 motifs 3 (ADAMTS-3)-deficient mice and cleavage-resistant Reelin knock-in mice. Both male and female animals were used. These data indicate that Reelin-Dab1 signaling regulates the proliferation and radial distribution of OPCs in the late embryonic neocortex and that the regulation of Reelin function by its specific proteolysis is required for the normal development of OPCs.SIGNIFICANCE STATEMENT Here, we report that Reelin-Dab1 signaling regulates the proliferation and radial distribution of OPCs in the late embryonic mouse neocortex. Oligodendrocyte (OL) progenitor cells (OPCs) express Reelin signaling molecules and respond to Reelin stimulation. Reelin-Dab1 signaling suppresses the proliferation of OPCs both in vitro and in vivo Reelin repels OPCs in vitro, and the radial distribution of OPCs is altered in mice with either attenuated or augmented Reelin-Dab1 signaling. This is the first report identifying the secreted molecule that plays a role in the radial distribution of OPCs in the late embryonic neocortex. Our results also show that the regulation of Reelin function by its specific proteolysis is important for the normal development of OPCs.

Keywords: Dab1; Reelin; migration; neocortex; oligodendrocyte progenitor cell.


Figures

Figure 1.
Figure 1.
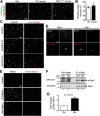
OPCs express canonical Reelin signaling components and respond to Reelin stimulation. A, OPCs from the animals indicated above were cultured and immunostained for PDGFRα (green) and Olig2 (red). Nuclei were stained with Hoechst 33342 (blue). Scale bar: 50 µm. B, Quantification of the percentage of PDGFRα+Olig2+ cells in OPC cultures from rat (white bar) or mouse (black bar). N = 3 (rat), 4 (mouse). C, Rat OPCs were transfected with control (top panels) or two different kinds of siRNA for VLDLR (middle and bottom panels). OPCs were then immunostained for VLDLR (left) and Olig2. The merged images are shown on the right. Arrows indicate cells in which VLDLR signals are low. Scale bar: 50 µm. D, Sections of the neocortex from Vldlr+/+ or Vldlr–/– mice at E18.5 were immunostained with antibodies against VLDLR (green), PDGFRα (red), and Olig2 (blue). Arrows indicate VLDLR expression in PDGFRα+Olig2+ OPCs. Scale bar: 10 µm. E, Rat OPCs were incubated for 6 h with vehicle only (control, top panels), WT-Reelin (middle panels), or mutant-Reelin (KA2-Reelin, bottom panels) that cannot bind to Reelin receptors. Cells were immunostained for Reelin (left panels). Merged images with nuclei (stained with Hoechst 33342, magenta) are shown on the right. Scale bar: 50 µm. F, OPCs from Reln–/– mice were incubated with vehicle only (Ctrl) or WT-Reelin (Rln) for 20 min. Dab1 was immunoprecipitated from the lysates. The samples were separated by SDS-PAGE and analyzed by WB with anti-phosphotyrosine antibody (upper panel) or anti-Dab1 antibody (lower panel). The positions of the molecular mass markers (kDa) are shown on the left of the panel. G, Quantification of Dab1 phosphorylation. The data were analyzed using a one-sample t test. N = 3.
Figure 2.
Figure 2.
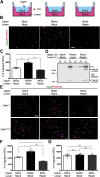
Reelin affects the proliferation of OPCs in a Dab1-dependent manner. A, Rat OPCs were incubated with vehicle only (control, left), WT-Reelin (middle), or KA2-Reelin (right) for 19 h and a further 5 h in the presence of BrdU. OPCs were immunostained for BrdU (green) and Olig2 (red). Nuclei were stained using Hoechst 33342 (blue). Scale bar: 300 µm. B, Quantification of the percentage of BrdU+Olig2+ cells in rat Olig2+ OPCs. The data were analyzed using one-way ANOVA (F(2,15) = 19.68, p < 0.0001) followed by Tukey–Kramer post hoc test; ***p < 0.001 and ****p < 0.0001. Control, N = 7; WT-Reelin, N = 6; KA2-Reelin, N = 4. C, OPCs from Dab1+/+ (upper panels) or Dab1yot/yot (lower panels) mice were incubated with vehicle only (control, left) or WT-Reelin (middle) for 19 h and a further 5 h in the presence of BrdU. OPCs were immunostained for BrdU (green) and Olig2 (red). Nuclei were stained using Hoechst 33342 (blue). Scale bar: 300 µm. D, Quantification of the percentage of BrdU+Olig2+ cells in Dab1+/+ Olig2+ OPCs. The data were analyzed using a two-tailed Student's t test. N = 4. E, Quantification of the percentage of BrdU+Olig2+ cells in Dab1yot/yot Olig2+ OPCs. The data were analyzed using a two-tailed Student's t test. N = 7.
Figure 3.
Figure 3.
Reelin affects the migration of OPCs in a Dab1-dependent manner in vitro. A, Schematic diagram of the Boyden chamber assay. OPCs were cultured with vehicle only (Mock) or WT-Reelin (Reelin) in the upper or lower wells for 24 h. B, Rat OPCs were incubated for 24 h with mock or Reelin as described above the images of the Boyden chamber. Cells that migrated into the lower wells through the 8-µm pores of the membrane were immunostained for Olig2 (green) and PDGFRα (magenta). Scale bar: 50 µm. C, The number of PDGFRα+Olig2+ OPCs that migrated into the lower side of the membrane was counted. The culture media in the inserts and plates are indicated below the graph. The data were analyzed using one-way ANOVA (F(2,9) = 54.89, p < 0.0001) followed by Tukey–Kramer post hoc test; *p < 0.05 and ***p < 0.001. N = 4. D, WB analysis of the culture medium placed in the inserts (upper wells, U) or the lower wells (L) using anti-Reelin antibody. The culture media in the inserts and plates are indicated below the figure. Positions of molecular mass markers (kDa) are shown on the left of the panel. FL: full-length Reelin. E, OPCs derived from Dab1+/+ mice (upper panels) or Dab1yot/yot mice (lower panels) were incubated for 24 h with mock or Reelin as described above the images of the Boyden chamber for 24 h. The cells that migrated into the lower wells through the 8-µm pores of the membrane were immunostained for Olig2 (green) and PDGFRα (magenta). Scale bar: 50 µm. F, The number of PDGFRα+Olig2+ OPCs derived from Dab1+/+ mice that migrated into the lower side of the membrane was counted. The culture media in the inserts and plates are indicated below the graph. The data were analyzed using one-way ANOVA (F(2,6) = 29.86, p = 0.0008) followed by Tukey–Kramer post hoc test; *p < 0.05 and ***p < 0.001. N = 3. G, The number of PDGFRα+Olig2+ OPCs derived from Dab1yot/yot mice that migrated into the lower side of the membrane was counted. The culture media in the inserts and plates are indicated below the graph. The data were analyzed using one-way ANOVA (F(2,9) = 0.1285, p = 0.8810) followed by Tukey–Kramer post hoc test. N.S., not significant. N = 4.
Figure 4.
Figure 4.
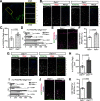
The number and distribution of OPCs are altered in Reelin heterozygote-deficient and Dab1 heterozygote-deficient mutant mice. A, Coronal sections of mouse brain at E18.5 were immunostained with antibodies against PDGFRα (green) and Olig2 (red). Nuclei were stained using Hoechst 33342. The magnified image of the part of primary somatosensory cortex (yellow box, left) is shown on the right. Primary somatosensory cortex was divided into four bins from the VZ to the MZ. Scale bar: 500 µm. B, Coronal sections of the primary somatosensory cortex of Reln+/+ and Reln+/– mice at E18.5 were immunostained with antibodies against PDGFRα (green) and Olig2 (red). Nuclei were stained using Hoechst 33342. Scale bar: 100 µm. C, D, Quantification of the density of OPCs in the primary somatosensory cortex (C) and in each of four equal-size bins (D). The data were analyzed using a two-tailed Student's t test and FDR-adjusted q values are shown. n = 5 each. E, Coronal sections of the primary somatosensory cortex of Reln+/+ and Reln+/– mice at E18.5 were immunostained with antibodies against Ki67 (green) and PDGFRα (red). Nuclei were stained using Hoechst 33342. Arrows indicate Ki67+PDGFRα+ cells. Scale bar: 100 µm. F, Quantification of the percentage of Ki67+PDGFRα+ cells of total PDGFRα+ cells. The data were analyzed using a two-tailed Student's t test. n = 5 each. G, Coronal sections of the primary somatosensory cortex of Dab1+/+ and Dab1+/yot mice at E18.5 were immunostained with antibodies against PDGFRα (green) and Olig2 (red). Nuclei were stained using Hoechst 33342. Scale bar: 100 µm. H, I, Quantification of the density of OPCs in the primary somatosensory cortex (H) and in each of four equal-size bins (I). The data were analyzed using a two-tailed Student's t test, and FDR-adjusted q values are shown. n = 6 each. J, Coronal sections of the primary somatosensory cortex of Dab1+/+ and Dab1+/yot mice at E18.5 were immunostained with antibodies against Ki67 (green) and PDGFRα (red). Nuclei were stained using Hoechst 33342. Arrows indicate Ki67+PDGFRα+ cells. Scale bar: 100 µm. K, Quantification of the percentage of Ki67+PDGFRα+ cells of total PDGFRα+ cells. The data were analyzed using a two-tailed Student's t test. n = 3 each.
Figure 5.
Figure 5.
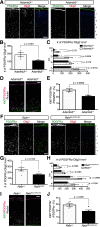
The number and distribution of OPCs are altered in VLDLR-deficient mice. A, Coronal sections of the primary somatosensory cortex of Vldlr+/+ and Vldlr–/– mice at E18.5 were immunostained with antibodies against PDGFRα (green) and Olig2 (red). Nuclei were stained using Hoechst 33342. Scale bar: 100 µm. B, C, Quantification of the density of OPCs in the primary somatosensory cortex (B) and in each of four equal-size bins (C). The data were analyzed using a two-tailed Student's t test, and FDR-adjusted q values are shown. n = 6 each. D, Coronal sections of the primary somatosensory cortex of Vldlr+/+ and Vldlr–/– mice at E18.5 were immunostained with antibodies against Ki67 (green) and PDGFRα (red). Nuclei were stained using Hoechst 33342. Arrows indicate Ki67+PDGFRα+ cells. Scale bar: 100 µm. E, Quantification of the percentage of Ki67+PDGFRα+ cells of total PDGFRα+ cells. The data were analyzed using a two-tailed Student's t test. n = 5 each.
Figure 6.
Figure 6.
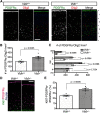
The number and distribution of OPCs are altered in mice with abrogated Reelin cleavage. A, Coronal sections of the primary somatosensory cortex of Adamts3+/+ and Adamts3–/– mice at E18.5 were immunostained with antibodies against PDGFRα (green) and Olig2 (red). Nuclei were stained using Hoechst 33342. Scale bar: 100 µm. B, C, Quantification of the density of OPCs in the primary somatosensory cortex (B) and in each of four equal-size bins (C). The data were analyzed using a two-tailed Student's t test, and FDR-adjusted q values are shown. n = 4 each. D, Coronal sections of the primary somatosensory cortex of Adamts3+/+ and Adamts3–/– mice at E18.5 were immunostained with antibodies against Ki67 (green) and PDGFRα (red). Nuclei were stained using Hoechst 33342. Arrows indicate Ki67+PDGFRα+ cells. Scale bar: 100 µm. E, Quantification of the percentage of Ki67+PDGFRα+ cells of total PDGFRα+ cells. The data were analyzed using a two-tailed Student's t test. n = 4 each. F, Coronal sections of the primary somatosensory cortex of Reln+/+ and RelnPA-DV/PA-DV mice at E18.5 were immunostained with antibodies against PDGFRα (green) and Olig2 (red). Nuclei were stained using Hoechst 33342. Scale bar: 100 µm. G, H, Quantification of the density of OPCs in the primary somatosensory cortex (G) and in each of four equal-size bins (H). The data were analyzed using a two-tailed Student's t test, and FDR-adjusted q values are shown. n = 6 each. I, Coronal sections of the primary somatosensory cortex of Reln+/+ and RelnPA-DV/PA-DV mice at E18.5 were immunostained with antibodies against Ki67 (green) and PDGFRα (red). Nuclei were stained using Hoechst 33342. Arrows indicate Ki67+PDGFRα+ cells. Scale bar: 100 µm. J, Quantification of Ki67+PDGFRα+ cells of total PDGFRα+ cells. The data were analyzed using a two-tailed Student's t test. n = 5 each.
Figure 7.
Figure 7.
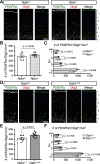
The effect of Reelin–Dab1 signaling on the number and distribution of OPCs becomes small in the postnatal brain. A, Coronal sections of the primary somatosensory cortex of Reln+/+ and Reln+/– mice at P2 were immunostained with antibodies against PDGFRα (green) and Olig2 (red). Nuclei were stained using Hoechst 33342. Scale bar: 100 µm. B, C, Quantification of the density of OPCs in the primary somatosensory cortex (B) and in each of four equal-size bins (C). The data were analyzed using a two-tailed Student's t test, and FDR-adjusted q values are shown. n = 7 each. D, Coronal sections of the primary somatosensory cortex of Dab1+/+ and Dab1+/yot mice at P2 were immunostained with antibodies against PDGFRα (green) and Olig2 (red). Nuclei were stained using Hoechst 33342. Scale bar: 100 µm. E, F, Quantification of the density of OPCs in the primary somatosensory cortex (E) and in each of four equal-size bins (F). The data were analyzed using a two-tailed Student's t test, and FDR-adjusted q values are shown. n = 7 and 8 for Dab1+/+ and Dab1+/yot mice, respectively.
Figure 8.
Figure 8.
Schematic model how Reelin signaling affects OPCs' development in the late embryonic neocortex. Reelin (yellow) is secreted from Cajal–Retzius (gray oval) cells located in the MZ and diffuses toward the VZ. ADAMTS-3 is relatively strongly expressed in the deep layer of the neocortex (red). Thus, it can be speculated that the strength of Reelin signaling exists in a graded manner. The proliferation and distribution of OPCs are negatively regulated by Reelin signaling.

Similar articles

Cited by

References

    1. Arai K, Lo EH (2009) An oligovascular niche: cerebral endothelial cells promote the survival and proliferation of oligodendrocyte precursor cells. J Neurosci 29:4351–4355. 10.1523/JNEUROSCI.0035-09.2009 - DOI - PMC - PubMed
    1. Benjamini Y, Hochberg Y (1995) Controlling the false discovery rate: a practical and powerful approach to multiple testing. J R Statist Soc B 57:289–300. 10.1111/j.2517-6161.1995.tb02031.x - DOI
    1. Bergles DE, Richardson WD (2016) Oligodendrocyte development and plasticity. Cold Spring Harb Perspect Biol 8:a020453 10.1101/cshperspect.a020453 - DOI - PMC - PubMed
    1. Birey F, Kokkosis AG, Aguirre A (2017) Oligodendroglia-lineage cells in brain plasticity, homeostasis and psychiatric disorders. Curr Opin Neurobiol 47:93–103. 10.1016/j.conb.2017.09.016 - DOI - PMC - PubMed
    1. Bradley A, Anastassiadis K, Ayadi A, Battey JF, Bell C, Birling MC, Bottomley J, Brown SD, Bürger A, Bult CJ, Bushell W, Collins FS, Desaintes C, Doe B, Economides A, Eppig JT, Finnell RH, Fletcher C, Fray M, Frendewey D, et al. (2012) The mammalian gene function resource: the international knockout mouse consortium. Mamm Genome 23:580–586. 10.1007/s00335-012-9422-2 - DOI - PMC - PubMed

Publication types

MeSH terms

LinkOut - more resources