Splicing Enhancers at Intron-Exon Borders Participate in Acceptor Splice Sites Recognition
- PMID: 32911621
- PMCID: PMC7554774
- DOI: 10.3390/ijms21186553
Splicing Enhancers at Intron-Exon Borders Participate in Acceptor Splice Sites Recognition
Abstract
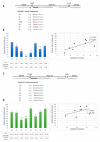
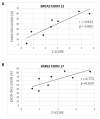
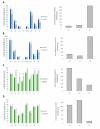
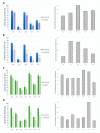
Acceptor splice site recognition (3' splice site: 3'ss) is a fundamental step in precursor messenger RNA (pre-mRNA) splicing. Generally, the U2 small nuclear ribonucleoprotein (snRNP) auxiliary factor (U2AF) heterodimer recognizes the 3'ss, of which U2AF35 has a dual function: (i) It binds to the intron-exon border of some 3'ss and (ii) mediates enhancer-binding splicing activators' interactions with the spliceosome. Alternative mechanisms for 3'ss recognition have been suggested, yet they are still not thoroughly understood. Here, we analyzed 3'ss recognition where the intron-exon border is bound by a ubiquitous splicing regulator SRSF1. Using the minigene analysis of two model exons and their mutants, BRCA2 exon 12 and VARS2 exon 17, we showed that the exon inclusion correlated much better with the predicted SRSF1 affinity than 3'ss quality, which were assessed using the Catalog of Inferred Sequence Binding Preferences of RNA binding proteins (CISBP-RNA) database and maximum entropy algorithm (MaxEnt) predictor and the U2AF35 consensus matrix, respectively. RNA affinity purification proved SRSF1 binding to the model 3'ss. On the other hand, knockdown experiments revealed that U2AF35 also plays a role in these exons' inclusion. Most probably, both factors stochastically bind the 3'ss, supporting exon recognition, more apparently in VARS2 exon 17. Identifying splicing activators as 3'ss recognition factors is crucial for both a basic understanding of splicing regulation and human genetic diagnostics when assessing variants' effects on splicing.
Keywords: SRSF1; U2AF35; acceptor splice site recognition; pre-mRNA splicing; splicing enhancer.
Conflict of interest statement
The authors declare no conflict of interest.
Figures


Similar articles
-
Impact of acceptor splice site NAGTAG motif on exon recognition.Mol Biol Rep. 2019 Jun;46(3):2877-2884. doi: 10.1007/s11033-019-04734-6. Epub 2019 Mar 6. Mol Biol Rep. 2019. PMID: 30840204
-
HNRNPA1 promotes recognition of splice site decoys by U2AF2 in vivo.Genome Res. 2018 May;28(5):689-698. doi: 10.1101/gr.229062.117. Epub 2018 Apr 12. Genome Res. 2018. PMID: 29650551 Free PMC article.
-
Alternative splicing of U2AF1 reveals a shared repression mechanism for duplicated exons.Nucleic Acids Res. 2017 Jan 9;45(1):417-434. doi: 10.1093/nar/gkw733. Epub 2016 Aug 26. Nucleic Acids Res. 2017. PMID: 27566151 Free PMC article.
-
A novel role of U1 snRNP: Splice site selection from a distance.Biochim Biophys Acta Gene Regul Mech. 2019 Jun;1862(6):634-642. doi: 10.1016/j.bbagrm.2019.04.004. Epub 2019 Apr 28. Biochim Biophys Acta Gene Regul Mech. 2019. PMID: 31042550 Free PMC article. Review.
-
Introns with branchpoint-distant 3' splice sites: Splicing mechanism and regulatory roles.Biophys Chem. 2024 Nov;314:107307. doi: 10.1016/j.bpc.2024.107307. Epub 2024 Aug 8. Biophys Chem. 2024. PMID: 39173313 Review.
Cited by
-
circSLC41A1 Resists Porcine Granulosa Cell Apoptosis and Follicular Atresia by Promoting SRSF1 through miR-9820-5p Sponging.Int J Mol Sci. 2022 Jan 28;23(3):1509. doi: 10.3390/ijms23031509. Int J Mol Sci. 2022. PMID: 35163432 Free PMC article.
-
Nucleotides in both donor and acceptor splice sites are responsible for choice in NAGNAG tandem splice sites.Cell Mol Life Sci. 2021 Nov;78(21-22):6979-6993. doi: 10.1007/s00018-021-03943-2. Epub 2021 Oct 1. Cell Mol Life Sci. 2021. PMID: 34596691 Free PMC article.
-
Three Variants Affecting Exon 1 of Ectodysplasin A Cause X-Linked Hypohidrotic Ectodermal Dysplasia: Clinical and Molecular Characteristics.Front Genet. 2022 Jul 6;13:916340. doi: 10.3389/fgene.2022.916340. eCollection 2022. Front Genet. 2022. PMID: 35873474 Free PMC article.
-
The Many Roads from Alternative Splicing to Cancer: Molecular Mechanisms Involving Driver Genes.Cancers (Basel). 2024 Jun 1;16(11):2123. doi: 10.3390/cancers16112123. Cancers (Basel). 2024. PMID: 38893242 Free PMC article. Review.
-
LncRNA Pnky Positively Regulates Neural Stem Cell Migration by Modulating mRNA Splicing and Export of Target Genes.Cell Mol Neurobiol. 2023 Apr;43(3):1199-1218. doi: 10.1007/s10571-022-01241-4. Epub 2022 Jun 24. Cell Mol Neurobiol. 2023. PMID: 35748966
References
-
- Burge C.B., Tuschl T., Sharp P.A. 20 Splicing of Precursors to mRNAs by the Spliceosomes. Cold Spring Harb. Monogr. Arch. 1999;37:525–560. doi: 10.1101/0.525-560. - DOI
MeSH terms
Substances
Grants and funding
LinkOut - more resources
Full Text Sources
Miscellaneous

