This is a preprint.
Disease burden and clinical severity of the first pandemic wave of COVID-19 in Wuhan, China
- PMID: 32909016
- PMCID: PMC7480068
- DOI: 10.1101/2020.08.27.20183228
Disease burden and clinical severity of the first pandemic wave of COVID-19 in Wuhan, China
Update in
-
Disease burden and clinical severity of the first pandemic wave of COVID-19 in Wuhan, China.Nat Commun. 2020 Oct 27;11(1):5411. doi: 10.1038/s41467-020-19238-2. Nat Commun. 2020. PMID: 33110070 Free PMC article.
Abstract
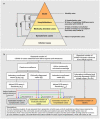
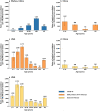
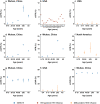
The pandemic of novel coronavirus disease 2019 (COVID-19) began in Wuhan, China, where a first wave of intense community transmission was cut short by interventions. Using multiple data source, we estimated the disease burden and clinical severity of COVID-19 by age in Wuhan from December 1, 2019 to March 31, 2020. We adjusted estimates for sensitivity of laboratory assays and accounted for prospective community screenings and healthcare seeking behaviors. Rates of symptomatic cases, medical consultations, hospitalizations and deaths were estimated at 796 (95%CI: 703-977), 489 (472-509), 370 (358-384), and 36.2 (35.0-37.3) per 100,000 persons, respectively. The COVID-19 outbreak in Wuhan had higher burden than the 2009 influenza pandemic or seasonal influenza, and that clinical severity was similar to that of the 1918 influenza pandemic. Our comparison puts the COVID-19 pandemic into context and could be helpful to guide intervention strategies and preparedness for the potential resurgence of COVID-19.
Conflict of interest statement
Declaration of interests
H.Y. has received research funding from Sanofi Pasteur, GlaxoSmithKline, Yichang HEC Changjiang Pharmaceutical Company, and Shanghai Roche Pharmaceutical Company. None of those research funding is related to COVID-19. All other authors report no competing interests.
Figures


Similar articles
-
Disease burden and clinical severity of the first pandemic wave of COVID-19 in Wuhan, China.Nat Commun. 2020 Oct 27;11(1):5411. doi: 10.1038/s41467-020-19238-2. Nat Commun. 2020. PMID: 33110070 Free PMC article.
-
Case Fatality Risk of the First Pandemic Wave of Coronavirus Disease 2019 (COVID-19) in China.Clin Infect Dis. 2021 Jul 1;73(1):e79-e85. doi: 10.1093/cid/ciaa578. Clin Infect Dis. 2021. PMID: 32409826 Free PMC article.
-
Online Health Information Seeking Using "#COVID-19 Patient Seeking Help" on Weibo in Wuhan, China: Descriptive Study.J Med Internet Res. 2020 Oct 15;22(10):e22910. doi: 10.2196/22910. J Med Internet Res. 2020. PMID: 33001838 Free PMC article.
-
Using the COVID-19 to influenza ratio to estimate early pandemic spread in Wuhan, China and Seattle, US.EClinicalMedicine. 2020 Sep;26:100479. doi: 10.1016/j.eclinm.2020.100479. Epub 2020 Aug 12. EClinicalMedicine. 2020. PMID: 32838239 Free PMC article.
-
COVID-19 pandemic: A review based on current evidence.Indian J Pharmacol. 2020 Mar-Apr;52(2):117-129. doi: 10.4103/ijp.IJP_310_20. Epub 2020 Jun 3. Indian J Pharmacol. 2020. PMID: 32565599 Free PMC article. Review.
Cited by
-
Should we consider heparin prophylaxis in COVID-19 patients? a systematic review and meta-analysis.J Thromb Thrombolysis. 2021 Apr;51(3):830-832. doi: 10.1007/s11239-020-02253-x. Epub 2020 Aug 20. J Thromb Thrombolysis. 2021. PMID: 32816197 Free PMC article. No abstract available.
-
A hierarchical study for urban statistical indicators on the prevalence of COVID-19 in Chinese city clusters based on multiple linear regression (MLR) and polynomial best subset regression (PBSR) analysis.Sci Rep. 2022 Feb 4;12(1):1964. doi: 10.1038/s41598-022-05859-8. Sci Rep. 2022. PMID: 35121784 Free PMC article.
References
-
- Johns Hopkins University. Coronavirus (COVID-19) Information and Updates. https://www.coronavirustraining.org/live-map (accessed July 26 2020).
-
- Centers for Disease Control and Prevention. Past Pandemics. https://www.cdc.gov/flu/pandemic-resources/basics/past-pandemics.html (accessed May 4 2020).
-
- Health Commission of Hubei Province. Daily report on epidemic situation of COVID-19 in Hubei province. (In Chinese). http://wjw.hubei.gov.cn/bmdt/ztzl/fkxxgzbdgrfyyq/xxfb/index.shtml (accessed July 22 2020).
Publication types
LinkOut - more resources
Full Text Sources
