. 2020 Nov 16;88(12):e00289-20.
doi: 10.1128/IAI.00289-20. Print 2020 Nov 16.

Conserved ESX-1 Substrates EspE and EspF Are Virulence Factors That Regulate Gene Expression

Affiliations

Conserved ESX-1 Substrates EspE and EspF Are Virulence Factors That Regulate Gene Expression

Alexandra E Chirakos et al. Infect Immun. .

Abstract

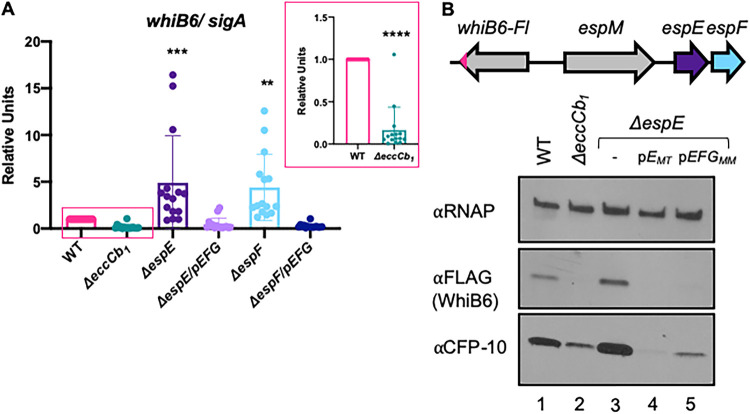
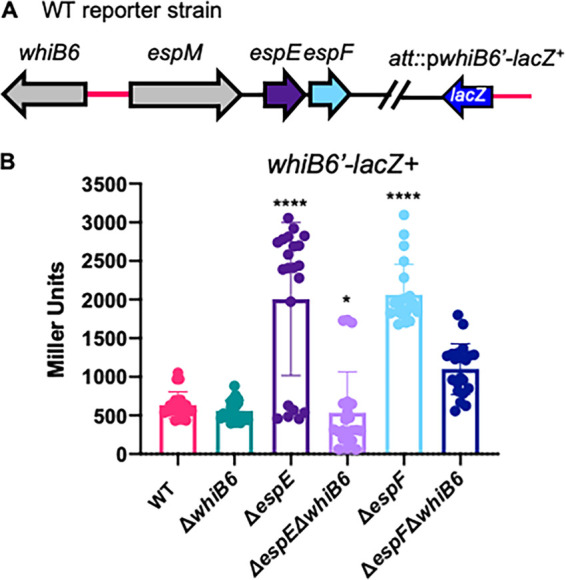
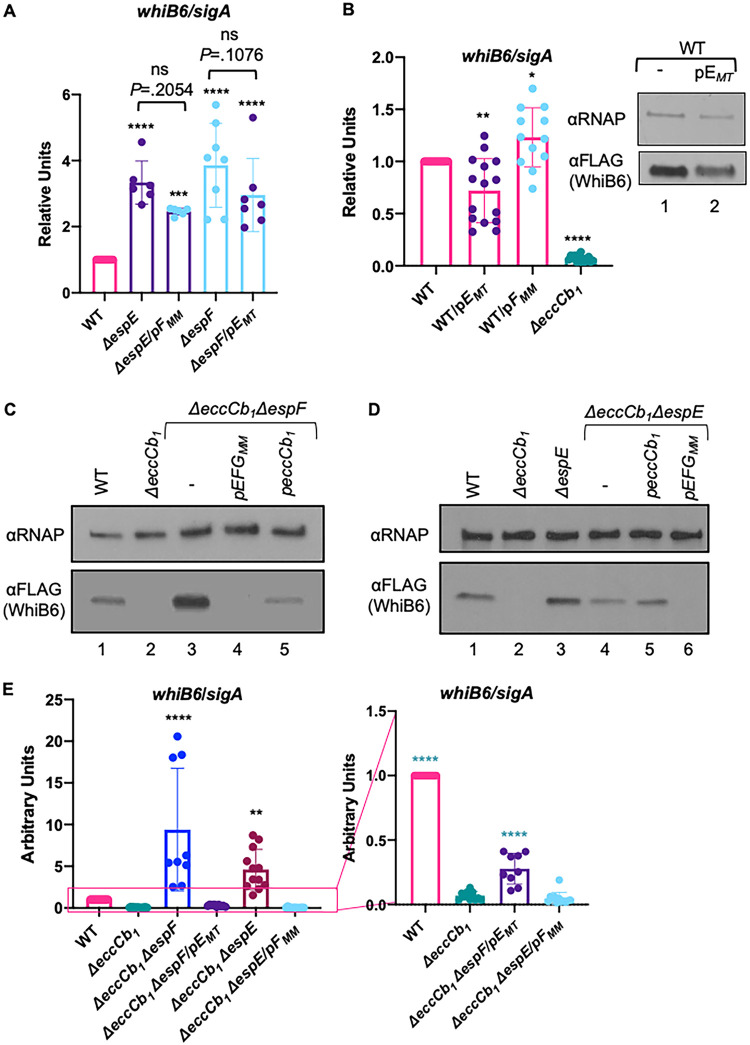
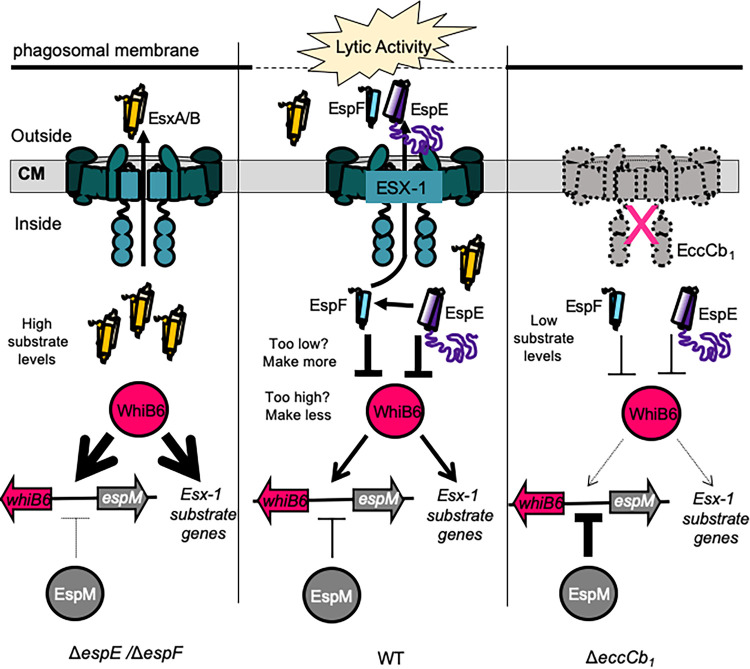
Mycobacterium tuberculosis, the cause of human tuberculosis, and Mycobacterium marinum, a nontubercular pathogen with a broad host range, require the ESX-1 secretion system for virulence. The ESX-1 system secretes proteins which cause phagosomal lysis within the macrophage via an unknown mechanism. As reported elsewhere (R. E. Bosserman et al., Proc Natl Acad Sci U S A 114:E10772-E10781, 2017, https://doi.org/10.1073/pnas.1710167114), we recently discovered that the ESX-1 system regulates gene expression in M. marinum This finding was confirmed in M. tuberculosis in reports by C. Sala et al. (PLoS Pathog 14:e1007491, 2018, https://doi.org/10.1371/journal.ppat.1007491) and A. M. Abdallah et al. (PLoS One 14:e0211003, 2019, https://doi.org/10.1371/journal.pone.0211003). We further demonstrated that a feedback control mechanism connects protein secretion to WhiB6-dependent expression of the esx-1 genes via an unknown mechanism. Here, we connect protein secretion and gene expression by showing for the first time that specific ESX-1 substrates have dual functions inside and outside the mycobacterial cell. We demonstrate that the EspE and EspF substrates negatively control esx-1 gene expression in the M. marinum cytoplasm through the conserved WhiB6 transcription factor. We found that EspE and EspF are required for virulence and promote lytic activity independently of the major EsxA and EsxB substrates. We show that the dual functions of EspE and EspF are conserved in the orthologous proteins from M. tuberculosis Our findings support a role for EspE and EspF in virulence that is independent of the EsxA and EsxB substrates and demonstrate that ESX-1 substrates have a conserved role in regulating gene expression.

Keywords: ESAT-6; ESX-1; Mycobacterium marinum; WhiB6; mycobacterial pathogenesis; protein secretion; type VII.


Figures

FIG 1
FIG 1
Generation and confirmation of M. marinum strains with unmarked deletions of the espE and espF genes. (A) Schematic of the genetic locus, including the espE and espF genes, in M. marinum. The locations of the primers used for PCR confirmation of each strain are indicated as arrows. For espE, the primer pair is olc183-olc184; for espF, the primer pair is olc1-olc2. PCR demonstrated the deletion of the espE and espF genes. M. marinum genomic coordinates: espF, 6580500 to 6580811 bp; espE, 6579146 to 6580402 bp. (B) qRT-PCR analysis of espF and espE transcripts relative to the levels of sigA transcript in the indicated M. marinum strains. ΔΔCT compared to the WT strain is shown. Data are averages for 3 independent biological replicates, each with 3 technical replicates. Error bars indicate standard deviations. Significance was determined using a one-way ordinary analysis of variance (ANOVA) (P < 0.0001) followed by Dunnett’s multiple-comparison test. Significance is shown relative to the WT strain. For espF transcript levels, ***, P = 0.001, * (ΔespF/pEFG), P = 0.0169, and * (ΔespE/pEFG), P = 0.0263. For espE transcript levels, ****, P < 0.0001, and ***, P = 0.0002.
FIG 2
FIG 2
EspE and EspF are required for virulence but are dispensable for EsxA and EsxB secretion from M. marinum. (A) Survival of M. marinum in RAW 264.7 cells. Data are averages and standard deviations for two independent biological replicates each in technical triplicate. The data are representative of three independent experiments. MOI = 1. Significance was determined using a two-way ANOVA (P < 0.0001) followed by Tukey’s multiple-comparison test. Significance is shown for the final time point. Further significance is discussed in the text. ****, P < 0.0001; ns, not significant. (B) Cytolytic activity of M. marinum strains 24 h after infection of RAW 264.7 cells. Cytolytic activity was measured as EthD-1-positive permeabilized cells. MOI = 7. Data are averages for 3 independent infections, each with three technical replicates. Error bars represent standard deviations. Each data point is a single field, with at least 30 fields per independent experiment (10 in each of three wells). Significance was determined using a one-way ordinary ANOVA (P < 0.0001) followed by Tukey’s multiple-comparison test. Values shown are relative to the WT strain. ****, P < 0.0001; ***, P = 0.0003. (C) Western blot analysis of whole-cell lysates (cell-associated protein fraction [left]) and culture supernatants (secreted protein fraction [right]) from M. marinum strains. MPT-32 is a protein secreted by the Sec system that serves as a loading control. RNAP is a lysis control. αCFP-10 and αESAT-6 detect EsxB and EsxA. Note that in this Western blot, we did not see reduced levels of EsxB and EspE protein in the eccCb1 strain, likely because the reductions in esxB and espE transcripts in this strain are only ∼2-fold. Ten micrograms of protein was loaded in each lane. Blots shown are representative of three independent biological replicates.
FIG 3
FIG 3
EspE and EspF are required for hemolytic activity in M. marinum. Hemolytic activity of M. marinum strains is shown. The data presented are averages for 3 independent biological replicates each with three technical replicates. dH2O (distilled water) is the positive control, and PBS is the negative control. Both controls are bacterium free. Significance was determined using a one-way ordinary ANOVA (P < 0.0001) followed by Dunnett’s multiple-comparison test relative to the WT strain. ****, P < 0.0001; **, P = 0.0010 (ΔespF/pFMM) and 0.0030 (ΔespF/pEFMT). Error bars represent standard deviations. A schematic of complementation plasmids from M. marinum and M. tuberculosis and the specific genomic coordinates for each plasmid are presented in Table 1.
FIG 4
FIG 4
The accumulation of EsxA and EsxB in the absence of EspE or EspF requires WhiB6. Western blot analysis of whole-cell lysates from M. marinum strains measured EsxA and EsxB levels in the presence and absence of whiB6 and espF (A) or espE (B). Ten micrograms of protein was loaded in each lane. Blots are representative of at least three independent biological replicates.
FIG 5
FIG 5
EspE and EspF negatively control whiB6 gene expression. (A) qRT-PCR of whiB6 transcript levels relative to sigA transcript levels in the indicated M. marinum strains. ΔΔCT compared to the WT strain is shown. Data are averages for 5 biological replicates, each with 3 technical replicates. All data points are shown. Error bars represent standard deviations. Significance was determined using a one-way ordinary ANOVA (P < 0.0001) followed by Dunnett’s multiple-comparison test. Significance is shown relative to the WT strain. ***, P = 0.0003; **, P = 0.0020. The graph in the pink box shows the levels of whiB6 transcript in the WT and ΔeccCb1 strains. Significance between these two strains was determined using an unpaired Student's t test. ****, P < 0.0001. (B) Western blot analysis measuring WhiB6 protein levels in the presence and absence of the espE gene. RNAP is the loading control. αFLAG measured WhiB6-Fl protein. Ten micrograms was loaded per lane. The blot shown is representative of at least three independent biological replicates.
FIG 6
FIG 6
EspE and EspF negatively regulate WhiB6 autoregulation. (A) Schematic of the whiB6′-lacZ+ WT reporter strain. The whiB6 promoter region (pink) was introduced upstream of the lacZ gene and integrated at the attB site. The same reporter plasmid was introduced into each isogenic strain. (B) β-Galactosidase assay measuring expression from the whiB6 promoter in the presence and absence of the espE, espF, and whiB6 genes. Data are averages for 6 independent biological replicates, each with three technical replicates. Technical replicates from all biological replicates are shown. Significance was determined using a one-way ordinary ANOVA (P < 0.0001) followed by a Dunnett’s multiple-comparison test relative to the WT strain. ****, P < 0.0001; *, P = 0.0173. Error bars represent standard deviations.
FIG 7
FIG 7
EspE and EspF are independently required for regulation of whiB6 expression in the absence of the ESX-1 system. qRT-PCR measured whiB6 gene expression relative to sigA expression in the indicated M. marinum strains. (A) Significance was determined using a one-way ordinary ANOVA (P < 0.0001) followed by Tukey’s multiple-comparison test. ****, P < 0.0001, and ***, P = 0.0004, relative to the WT strain. P values shown directly compare the bracketed strains. For all qRT-PCR data in this figure (A, B, and E), the data are means for at least three independent biological replicates, each in technical triplicates. All data points are shown. The error bars represent standard deviations. (B) Significance was determined using a one-way ordinary ANOVA (P < 0.0001) followed by Dunnett’s multiple-comparison test. ****, P < 0.0001, **, P = 0.0015, and *, P = 0.0149, relative to the WT strain. (B, C, and D) For all Western blots, whole-cell lysates generated from the indicated M. marinum strains which have the whiB6-Fl allele at the whiB6 locus. For all blots, RNAP is the loading control. αFLAG measures WhiB6-Fl protein. Blots are representative of at least three independent biological replicates. Ten micrograms of protein was loaded per lane. (E) qRT-PCR measuring whiB6 gene expression relative to sigA expression. Significance was determined using a one-way ordinary ANOVA (P < 0.0001) followed by Dunnett’s multiple-comparison test. ****, P < 0.0001, and **, P = 0.0068, relative to the WT strain. The levels of relative whiB6 expression in the WT, ΔeccCb1, and complemented strains is highlighted. Significance was determined using a one-way ordinary ANOVA (P < 0.0001) followed by Sidak’s multiple-comparison test. Significance relative to the ΔeccCb1 strain is shown. ****, P < 0.0001.
FIG 8
FIG 8
Model for feedback control of the ESX-1 system in M. marinum. We propose that the levels of ESX-1 substrates are controlled by balancing substrate secretion and WhiB6 autoregulation. Under WT conditions (middle), the levels of the EspE and EspF ESX-1 substrates control the autoregulation of WhiB6 and the levels of the ESX-1 substrates. ESX-1 secretion of EspE and EspF promotes ESX-1-mediated lysis. In the absence of an assembled ESX-1 system, or as a result of genetic inactivation (right), EspM represses whiB6 gene expression, and low levels of EspE and EspF damp WhiB6 autoregulation. In the absence of EspE or EspF (left), WhiB6 positively autoregulates, resulting in increased substrate gene expression. Substrate levels are elevated and still secreted from the cell. However, in the absence of EspE or EspF, ESX-1 substrates cannot promote ESX-1-mediated lysis.

Similar articles

Cited by

References

    1. Green ER, Mecsas J. 2016. Bacterial secretion systems: an overview. Microbiol Spectr 4:VMBF-0012-2015. doi:10.1128/microbiolspec.VMBF-0012-2015. - DOI - PMC - PubMed
    1. Stanley SA, Raghavan S, Hwang WW, Cox JS. 2003. Acute infection and macrophage subversion by Mycobacterium tuberculosis require a specialized secretion system. Proc Natl Acad Sci U S A 100:13001–13006. doi:10.1073/pnas.2235593100. - DOI - PMC - PubMed
    1. Hsu T, Hingley-Wilson SM, Chen B, Chen M, Dai AZ, Morin PM, Marks CB, Padiyar J, Goulding C, Gingery M, Eisenberg D, Russell RG, Derrick SC, Collins FM, Morris SL, King CH, Jacobs WR Jr.. 2003. The primary mechanism of attenuation of bacillus Calmette-Guerin is a loss of secreted lytic function required for invasion of lung interstitial tissue. Proc Natl Acad Sci U S A 100:12420–12425. doi:10.1073/pnas.1635213100. - DOI - PMC - PubMed
    1. Vaziri F, Brosch R. 2019. ESX/type VII secretion systems–an important way out for mycobacterial proteins. Microbiol Spectr 7:PSIB-0029-2019. doi:10.1128/microbiolspec.PSIB-0029-2019. - DOI - PMC - PubMed
    1. Abdallah AM, Gey van Pittius NC, Champion PA, Cox J, Luirink J, Vandenbroucke-Grauls CM, Appelmelk BJ, Bitter W. 2007. Type VII secretion–mycobacteria show the way. Nat Rev Microbiol 5:883–891. doi:10.1038/nrmicro1773. - DOI - PubMed

Publication types

MeSH terms

LinkOut - more resources