

Investigating the Role of Telomere and Telomerase Associated Genes and Proteins in Endometrial Cancer
- PMID: 32899298
- PMCID: PMC7565490
- DOI: 10.3390/mps3030063
Investigating the Role of Telomere and Telomerase Associated Genes and Proteins in Endometrial Cancer
Abstract
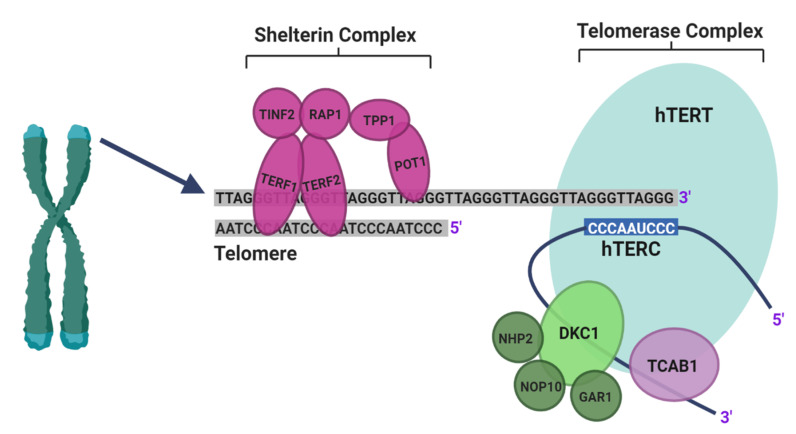
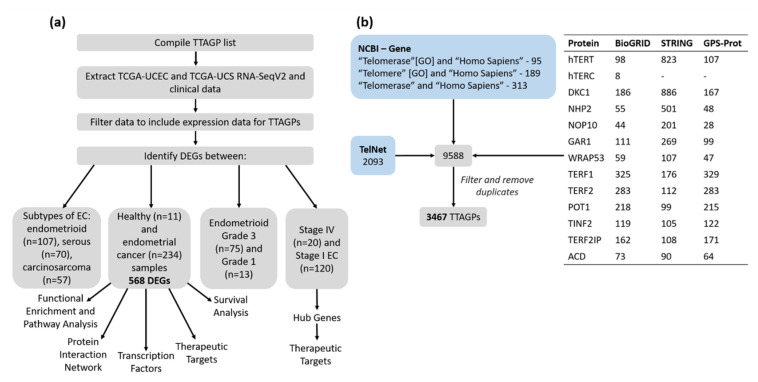
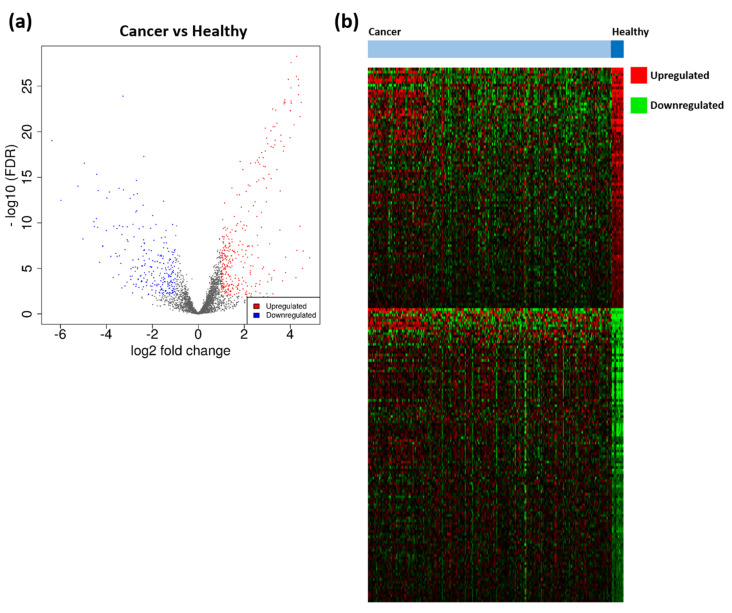
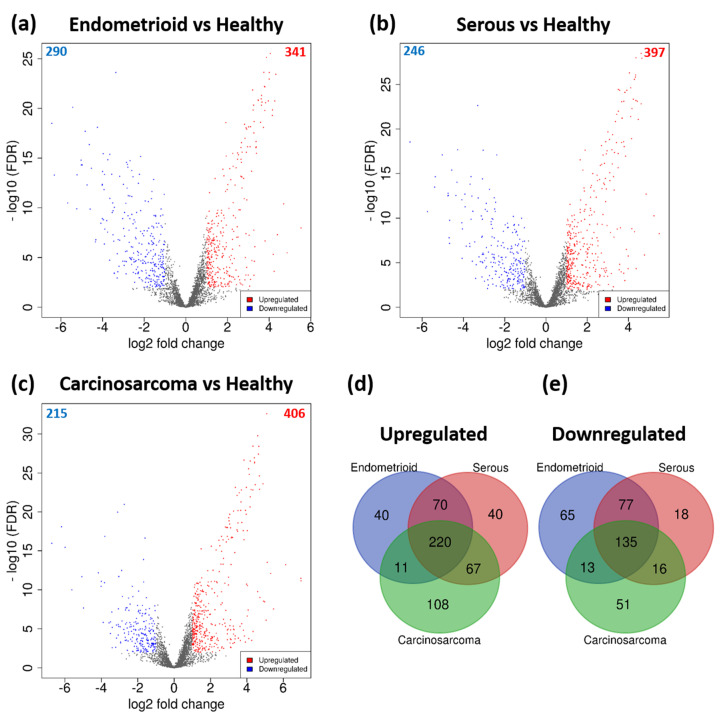
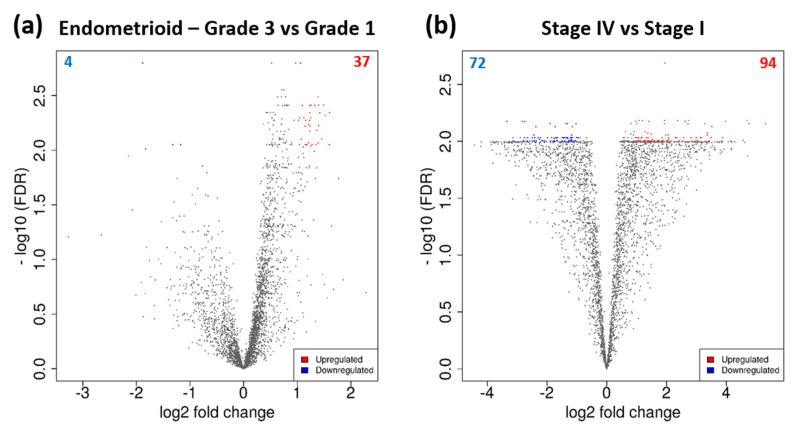
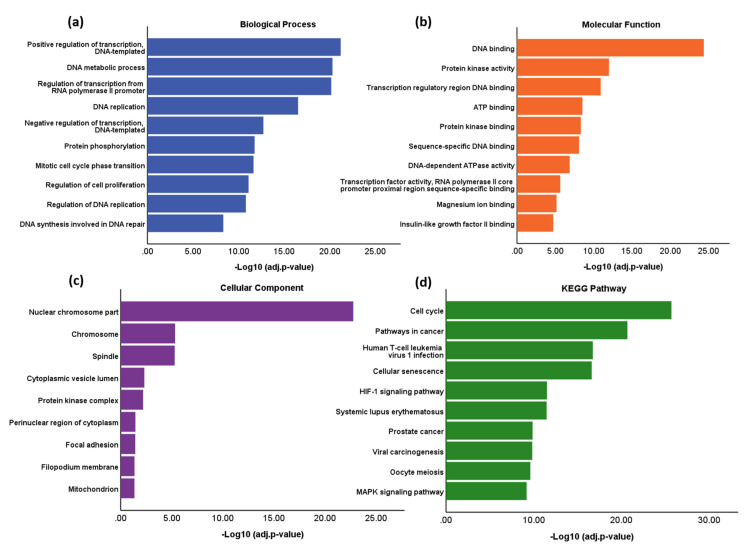
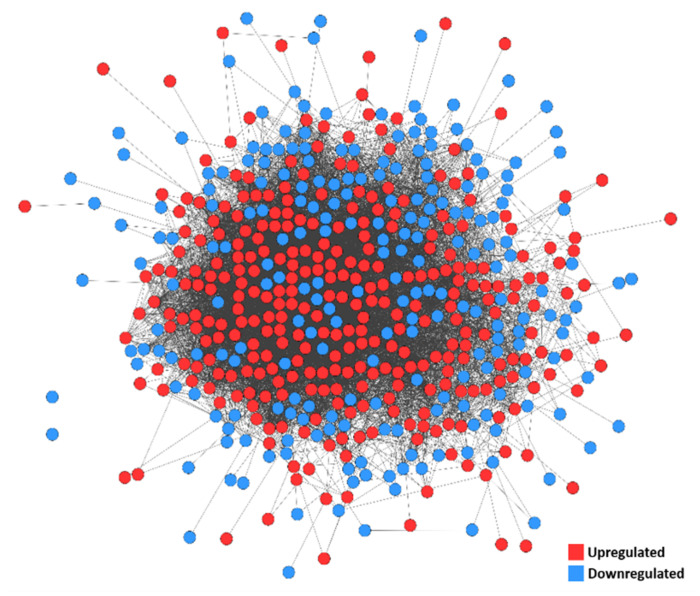
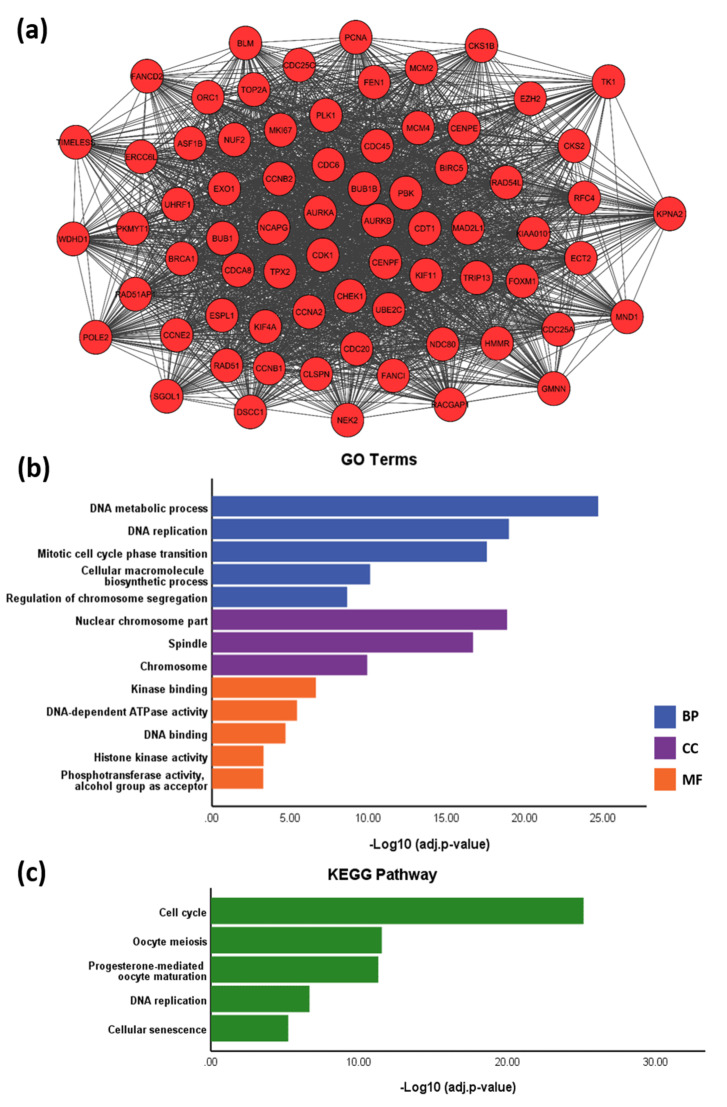
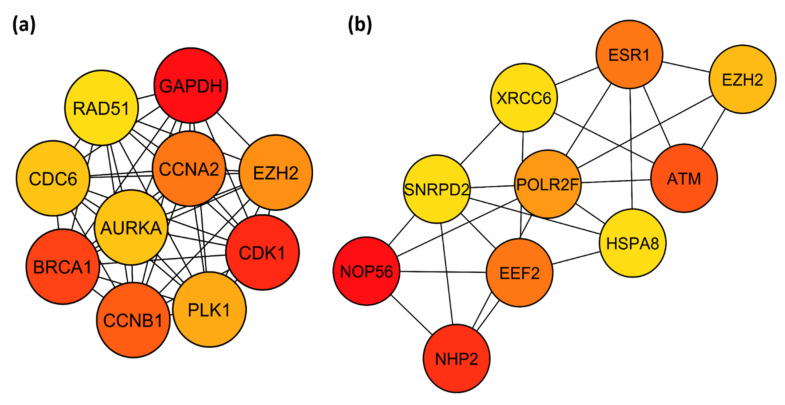
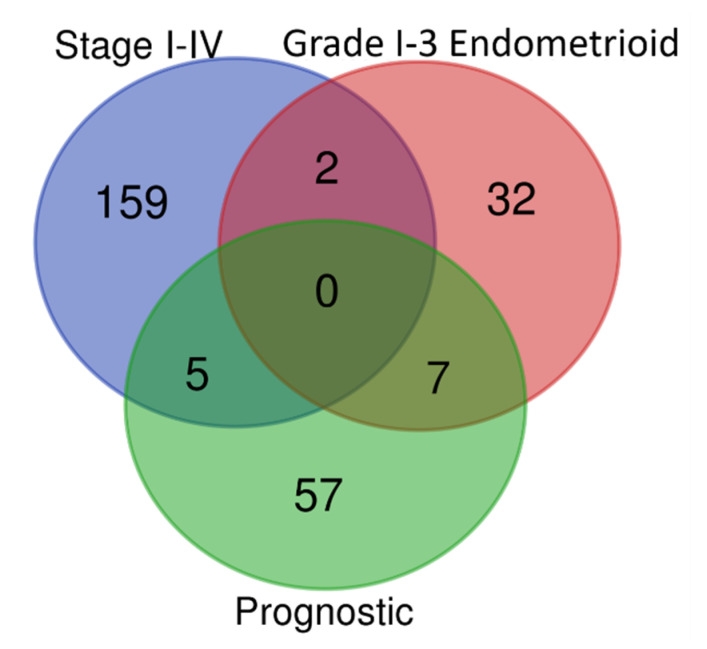
Endometrial cancer (EC) is the commonest gynaecological malignancy. Current prognostic markers are inadequate to accurately predict patient survival, necessitating novel prognostic markers, to improve treatment strategies. Telomerase has a unique role within the endometrium, whilst aberrant telomerase activity is a hallmark of many cancers. The aim of the current in silico study is to investigate the role of telomere and telomerase associated genes and proteins (TTAGPs) in EC to identify potential prognostic markers and therapeutic targets. Analysis of RNA-seq data from The Cancer Genome Atlas identified differentially expressed genes (DEGs) in EC (568 TTAGPs out of 3467) and ascertained DEGs associated with histological subtypes, higher grade endometrioid tumours and late stage EC. Functional analysis demonstrated that DEGs were predominantly involved in cell cycle regulation, while the survival analysis identified 69 DEGs associated with prognosis. The protein-protein interaction network constructed facilitated the identification of hub genes, enriched transcription factor binding sites and drugs that may target the network. Thus, our in silico methods distinguished many critical genes associated with telomere maintenance that were previously unknown to contribute to EC carcinogenesis and prognosis, including NOP56, WFS1, ANAPC4 and TUBB4A. Probing the prognostic and therapeutic utility of these novel TTAGP markers will form an exciting basis for future research.
Keywords: TCGA; bioinformatics analysis; endometrial cancer; prognosis; telomerase; telomere; transcriptome.
Conflict of interest statement
The authors declare no conflict of interest.
Figures
Similar articles
-
Telomere and Telomerase-Associated Proteins in Endometrial Carcinogenesis and Cancer-Associated Survival.Int J Mol Sci. 2022 Jan 6;23(2):626. doi: 10.3390/ijms23020626. Int J Mol Sci. 2022. PMID: 35054812 Free PMC article.
-
Implications of telomeres and telomerase in endometrial pathology.Hum Reprod Update. 2017 Mar 1;23(2):166-187. doi: 10.1093/humupd/dmw044. Hum Reprod Update. 2017. PMID: 27979878 Free PMC article. Review.
-
TTK, CDC25A, and ESPL1 as Prognostic Biomarkers for Endometrial Cancer.Biomed Res Int. 2020 Nov 17;2020:4625123. doi: 10.1155/2020/4625123. eCollection 2020. Biomed Res Int. 2020. PMID: 33282948 Free PMC article.
-
Construction of an Immune-Autophagy Prognostic Model Based on ssGSEA Immune Scoring Algorithm Analysis and Prognostic Value Exploration of the Immune-Autophagy Gene in Endometrial Carcinoma (EC) Based on Bioinformatics.J Healthc Eng. 2022 Feb 22;2022:7832618. doi: 10.1155/2022/7832618. eCollection 2022. J Healthc Eng. 2022. Retraction in: J Healthc Eng. 2023 Oct 11;2023:9834327. doi: 10.1155/2023/9834327. PMID: 35242299 Free PMC article. Retracted.
-
Telomerase and Telomeres in Endometrial Cancer.Front Oncol. 2019 May 17;9:344. doi: 10.3389/fonc.2019.00344. eCollection 2019. Front Oncol. 2019. PMID: 31157162 Free PMC article. Review.
Cited by
-
Role of Nucleolin in Endometrial Precancerous Hyperplasia and Carcinogenesis: Ex Vivo and In Silico Study.Int J Mol Sci. 2022 Jun 2;23(11):6228. doi: 10.3390/ijms23116228. Int J Mol Sci. 2022. PMID: 35682908 Free PMC article.
-
Detection of endometrial cancer using tampon-based collection and methylated DNA markers.Gynecol Oncol. 2023 Jul;174:11-20. doi: 10.1016/j.ygyno.2023.04.014. Epub 2023 May 2. Gynecol Oncol. 2023. PMID: 37141817 Free PMC article.
-
Mutual regulation between chicken telomerase reverse transcriptase and the Wnt/β-catenin signalling pathway inhibits apoptosis and promotes the replication of ALV-J in LMH cells.Vet Res. 2021 Aug 19;52(1):110. doi: 10.1186/s13567-021-00979-x. Vet Res. 2021. PMID: 34412690 Free PMC article.
-
A prognostic model for Schistosoma japonicum infection-associated liver hepatocellular carcinoma: strengthening the connection through initial biological experiments.Infect Agent Cancer. 2024 Mar 21;19(1):10. doi: 10.1186/s13027-024-00569-4. Infect Agent Cancer. 2024. PMID: 38515119 Free PMC article.
-
Human Endometrial Carcinogenesis Is Associated with Significant Reduction in Long Non-Coding RNA, TERRA.Int J Mol Sci. 2020 Nov 18;21(22):8686. doi: 10.3390/ijms21228686. Int J Mol Sci. 2020. PMID: 33217925 Free PMC article.
References
-
- Cancer Research UK Uterine Cancer Statistics. [(accessed on 9 November 2019)]; Available online: https://www.cancerresearchuk.org/health-professional/cancer-statistics/s....
-
- Billingsley C.C., Cansino C., O’Malley D.M., Cohn D.E., Fowler J.M., Copeland L.J., Backes F.J., Salani R. Survival outcomes of obese patients in type II endometrial cancer: Defining the prognostic impact of increasing BMI. Gynecol. Oncol. 2016;140:405–408. doi: 10.1016/j.ygyno.2016.01.020. - DOI - PubMed
Grants and funding
LinkOut - more resources
Full Text Sources
