. 2020 Dec:141:115627.
doi: 10.1016/j.bone.2020.115627. Epub 2020 Sep 3.

Bone regeneration is mediated by macrophage extracellular vesicles

Affiliations

Bone regeneration is mediated by macrophage extracellular vesicles

Miya Kang et al. Bone. 2020 Dec.

Abstract

Multiple local and systemic factors including inflammation influence bone regeneration. Several lines of evidence demonstrate that macrophages contribute to the immunological regulation of MSC and osteoblast function during bone regeneration. Recent studies demonstrate that macrophage polarization influences this regulatory process. In this manuscript, we investigated the paracrine functional role of naïve (M0), M1 and M2 polarized macrophage derived EVs in bone repair. Treatment of rat calvaria defects with no EVs, M0 EVs, M1 EVs, or M2 EVs revealed polarization-specific control of bone regeneration by macrophage EVs at 3 and 6 weeks. M0 and M2 EVs promoted repair/regeneration and M1 EVs inhibited bone repair. Pathway-specific studies conducted in cell culture showed that M1 EVs negatively regulated the BMP signaling pathway, specifically BMP2 and BMP9. In parallel, miRNA sequencing studies showed similar miRNA cargo in M0 and M2 EVs and different miRNA cargo in M1 EVs. Functional examination of M1 macrophage EV-enriched miR-155 demonstrated that miR-155 mimic treatment reduced MSC osteogenic differentiation as measured by reduced BMP2, BMP9 and RUNX2 expression when compared to controls. Conversely, treatment of MSCs with the M2 macrophage EV-enriched miR-378a mimic increased MSC osteoinductive gene expression when compared to controls. These functional studies implicate polarized macrophage EV miRNAs in the positive or negative regulation of bone regeneration that was observed in vivo. Overall, the results presented in this study indicate that macrophage polarization influences EV cargo and related EV function in the paracrine regulation of bone regeneration.

Keywords: Bone repair; Exosomes; Extracellular vesicles; Macrophages; Monocytes.


Figures

Figure 1:
Figure 1:. Polarization of naïve (M0) macrophage into M1 and M2 phenotypes:
A) Immunocytochemistry of M0, M1 and M2 macrophages for iNOS (green) and CD206 (green). Note the absence of both iNOS and CD206 positive staining in M0 cells, the enhanced staining of iNOS in M1 cells and CD206 in M2 cells. In all images, the cells were counterstained with tubulin antibody (red) and the nuclei were stained with DAPI (blue). Scalebar represents 10μm in all images. B) Quantitative RT PCR of M0, M1 and M2 differentiated cells for M1 (iNOS, IL-1β and TNFα) and M2 (Arg1, CD206 and FIZZ1) phenotypic markers. Note the significantly increased expression of the respective markers in the respectively differentiated cells. * represents statistical significance (P<0.05) with respect to M0 and M2 in the case of M1 markers and M0 and M1 in the case of M2 markers as measured by Tukey’s ad-hoc test post ANOVA. C) Immunoblots of M0, M1 and M2 cell lysates for M1 macrophage markers iNOS and M2 macrophage marker CD206. Tubulin was used as an intracellular protein control.
Figure 2:
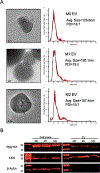
Figure 2:. Characterization of EVs:
A) TEM and NTA analysis of EVs isolated from M0, M1 and M2 macrophages. TEM images showed bilayered vesicles with sizes corresponding to exosomes. NTA analyses of the EVs showed a similar size distribution for all three types and a similar poly dispersity index (PDI). B) Immunoblots of EV and cell lysates for EV markers TSG101 and CD9. Actin was used as an intracellular protein control. Note actin positive staining only in the cell lysates.
Figure 3:
Figure 3:. Endocytosis of M0, M1 and M2 EVs by MSCs:
A) Dose dependent and saturable endocytosis of M0, M1 and M2 EVs by MSCs. Data represents mean +/− SD (n=6). B) Representative confocal images of fluorescently labeled control (labeling control without EVs), M0, M1 and M2 EVs (green) endocytosed by MSCs. 1.5×10⁹ EVs were added onto 5×10⁴ cells. In all images, the MSCs were counterstained with actin (red) and the nuclei were stained with DAPI (blue). Scale bar represents 20?m in all images.
Figure 4:
Figure 4:. Bone repair is influenced by M0, M1 and M2 EVs:
A) Representative 3D μCT images of rat calvaria at 3 and 6-weeks post wounding in the presence/absence of the respective EVs. Note the impairment of bone regeneration by M1 EVs at 3 weeks and the enhancement of bone regeneration by M0 and M2 EVs at both 3 and 6 weeks. B) Volumetric quantitation of the 3D μCT data. Graph represents mean percentage bone volume regenerated to total volume of the defect +/− SD. * represents statistical significance (P<0.05 as measured by Tukey’s ad-hoc test post ANOVA). C) Representative light microscopic images of the demineralized and paraffin embedded tissue sections stained with Hematoxylin and Eosin (H&E). The black arrow head in the images represent newly formed bone. Scale bar represents 500μm in all images.
Figure 5:
Figure 5:. Fluorescent IHC of calvarial sections for BMP2:
The figure shows representative confocal micrographs of calvarial sections from 3 and 6 week time points immunostained for BMP2. Note the increased expression of BMP2 in both M0 EVand M2 EV groups at both time points compared to the control group and M1 EV group.
Figure 6:
Figure 6:. Fluorescent IHC of calvarial sections for BSP:
The figure shows representative confocal micrographs of calvarial sections from 3 and 6 week time points immunostained for BSP. Note the increased expression of BSP in both M0 EV and M2 EV groups.
Figure 7:
Figure 7:. Fluorescent IHC of calvarial sections for iNOS and CD206:
A) Representative confocal micrographs of 3 week calvarial sections stained for iNOS (green) and CD206 (green). B) Quantiation of iNOS positive cells as percentage per field view. * represents statistical significance (P<0.05) calculated by Tukey’s ad-hoc test post ANOVA. C) Quantitation of CD206 positive cells as percentage per field view. Note the increase in the number of cells positive for CD206 in both the M0 and M2 EV groups compared to PBS and M1 EV groups and the absence of CD206 positive cells in the M1 EV group. * represents statistical significance (P<0.05) calculated by Tukey’s ad-hoc test post ANOVA. # represents statistical significane (P<0.05) with respect to PBS group. D) The ratio of iNOS/CD206 positive cells (normalized to DAPI) per field view. In all images nuclei are stained with DAPI. Scale bar represents 50μm in all images.
Figure 8:
Figure 8:. M0, M1 and M2 effects on BMP signaling:
A) Graph showing the fold change in the expression of BMP2 and BMP9 of MSCs co-cultured in the presence of M0, M1 and M2 macrophages. Data represent mean fold change with respect to the expression level in MSCs without macrophage co-culture +/− SD (n=4). * represents statistical significance (P<0.05) calculated by Tukey’s ad-hoc test post ANOVA. Note the significant reduction in BMP2 and BMP9 expression in the presence MSCs co-cultured with M1 macrophages. B) Graph representing relative expression of luciferase reporter driven by SBE12 SMAD 1/5/8 promoter to identify activation of the BMP2 signaling pathway in the presence and absence of rhBMP2 and M0, M1 and M2 EVs. Data represent mean +/− SD (n=4). * represents statistical significance (P<0.05) calculated by Tukey’s ad-hoc test post ANOVA. In the absence of EVs, no significant change in BMP2 reporter activity was observed. Note the increase in reporter activity in the presence of rhBMP2 and the effect of the corresponding EVs.
Figure 9:
Figure 9:. EV miRNAs in polarized macrophages:
A) A heat map of the top 25 differentially expressed miRNAs in M0, M1 and M2 EVs. B) KEGG analysis of relevant osteogenc pathways significantly affected by change in miRNA composition of Mtitle, M1 and M2 EVs depicted in the order of the number of genes affected in each pathway. The color coding of the bars represents statistical significance as per the legend.
Figure 10:
Figure 10:. Role of EV miRNAs on MSC differentiation:
A) Graph showing the fold change in the expression level of miR-155 and miR-378a in the M0, M1 and M2 EVs. Data represent mean fold change with respect to M0 EV expression +/− SD. B) Graph represents fold change in the presence of miR-155 or miR-378a after mouse MSCs were transfected with miR-155 or miR-378a mimics under osteogenic differentiation condition with respect to no mimics treatment. The significant increase in expression after transfection of the mimics confirming intracellular mimic presence. C) Graph representing fold change in the expression levels of BMP2, BMP9, RUNX2 and OSX in MSCs subjected to osteogenic stimulation (OS) in the presence and absence of miR-155 mimics over a period of 7 days with respect to growth medium condition. Note the significant reduction in BMP2, BMP9 and RUNX2 expression at day 4 in the presence of miR-155 mimics. D) Graph representing fold change in the expression levels of osteoinductive markers in MSCs subjected to osteogenic stimulation in the presence and absence of miR-378a mimics over a period of 7 days with respect to growth medium condition. Note the significant increase in BMP2 and BMP9 expression at day 4 in the presenece of miR-378a mimics. In all images * represents statistical significance (P<0.05) as measured by Tukey’s ad-hoc test post ANOVA.

Similar articles

Cited by

References

    1. Leibovich SJ and Ross R, “The role of the macrophage in wound repair. A study with hydrocortisone and antimacrophage serum,” Am. J. Pathol, vol. 78, no. 1, pp. 71–100, January. 1975. - PMC - PubMed
    1. Lucas T et al., “Differential roles of macrophages in diverse phases of skin repair,” J. Immunol, vol. 184, no. 7, pp. 3964–3977, April. 2010, doi: 10.4049/jimmunol.0903356. - DOI - PubMed
    1. Minutti CM, Knipper JA, Allen JE, and Zaiss DMW, “Tissue-specific contribution of macrophages to wound healing,” Semin. Cell Dev. Biol, vol. 61, pp. 3–11, 2017, doi: 10.1016/j.semcdb.2016.08.006. - DOI - PubMed
    1. Murray PJ, “Macrophage Polarization,” Annu. Rev. Physiol, vol. 79, pp. 541–566, 10 2017, doi: 10.1146/annurev-physiol-022516-034339. - DOI - PubMed
    1. Chang MK et al., “Osteal tissue macrophages are intercalated throughout human and mouse bone lining tissues and regulate osteoblast function in vitro and in vivo,” J. Immunol, vol. 181, no. 2, pp. 1232–1244, July. 2008, doi: 10.4049/jimmunol.181.2.1232. - DOI - PubMed

Publication types