. 2020 Sep 22;117(38):23970-23981.
doi: 10.1073/pnas.2011859117. Epub 2020 Sep 3.

Fruit setting rewires central metabolism via gibberellin cascades

Affiliations

Fruit setting rewires central metabolism via gibberellin cascades

Yoshihito Shinozaki et al. Proc Natl Acad Sci U S A. .

Abstract

Fruit set is the process whereby ovaries develop into fruits after pollination and fertilization. The process is induced by the phytohormone gibberellin (GA) in tomatoes, as determined by the constitutive GA response mutant procera However, the role of GA on the metabolic behavior in fruit-setting ovaries remains largely unknown. This study explored the biochemical mechanisms of fruit set using a network analysis of integrated transcriptome, proteome, metabolome, and enzyme activity data. Our results revealed that fruit set involves the activation of central carbon metabolism, with increased hexoses, hexose phosphates, and downstream metabolites, including intermediates and derivatives of glycolysis, the tricarboxylic acid cycle, and associated organic and amino acids. The network analysis also identified the transcriptional hub gene SlHB15A, that coordinated metabolic activation. Furthermore, a kinetic model of sucrose metabolism predicted that the sucrose cycle had high activity levels in unpollinated ovaries, whereas it was shut down when sugars rapidly accumulated in vacuoles in fruit-setting ovaries, in a time-dependent manner via tonoplastic sugar carriers. Moreover, fruit set at least partly required the activity of fructokinase, which may pull fructose out of the vacuole, and this could feed the downstream pathways. Collectively, our results indicate that GA cascades enhance sink capacities, by up-regulating central metabolic enzyme capacities at both transcriptional and posttranscriptional levels. This leads to increased sucrose uptake and carbon fluxes for the production of the constituents of biomass and energy that are essential for rapid ovary growth during the initiation of fruit set.

Keywords: fruit set; gibberellin; metabolic enzymes; parthenocarpy; tomatoes.


Conflict of interest statement

The authors declare no competing interest.

Figures
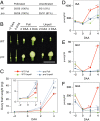
Fig. 1.
Fig. 1.
Fruit set in WT tomato and the GA response mutant procera (pro). (A) Pollination- and parthenocarpy-dependent fruit set rate. Number of developed fruits per attempt is also shown. (B and C) Representative pictures (B) and weights (C) of pollinated and unpollinated ovaries from −2 to 2 DAA (Inset) or 4 DAA. Values in C are mean ± SEs of six replicates, each one defined as the average ovary weight obtained by measuring a mixture of 5 to 10 ovaries. (DF) Endogenous levels of IAA (D) and bioactive GAs (E and F). Values in DF are mean ± SEs of three replicates. (Scale bar in B, 1 cm.) Asterisks in CF indicate significant differences from nongrowing unpollinated WT ovaries (Student's t test, P < 0.05). DAA, days after anthesis; Poll, pollination; Unpoll, unpollinated.
Fig. 2.
Fig. 2.
Network analysis across pollinated and unpollinated ovaries in WT tomato and procera (pro) mutants. (A and B) Heat map showing averaged relative reads per kilobase of the exons per million mapped reads (RPKM) of genes (A) and relative levels of metabolites (B) clustered in the individual WGCNA gene transcript (GenM) and metabolite (MetM) modules. (C) PCC of each pair of GenM and MetM module. Asterisks indicate pairs with PCC > 0.75 or < −0.75 (P < 0.05). Fruit set associated GenM–MetM subnetworks are indicated by blue (SN-1), orange (SN-2), or green (SN-3) boxes, which correspond to positive associations with fruit set until 4 DAA, 2 DAA, and a negative association with fruit set, respectively. Among the modules consisting of these subnetworks, those positively and negatively associated with fruit set are indicated by bold red and blue, respectively. Metabolite modules are indicated by italic. DAA, days after anthesis; Poll, pollinated; Unpoll, unpollinated.
Fig. 3.
Fig. 3.
Integrated network of transcript and metabolite modules. The orange rectangles and green circles represent nodes of coexpression of the WGCNA transcript (GenM) and metabolite (MetM) modules, respectively. Blue squares connected by dashed lines to transcript modules represent the nodes from the top five GO terms enriched in each module (false discovery rate [FDR]-adjusted P value <0.05, hypergeometric test). Edges with solid lines represent intermodular correlation (PCC > 0.75, P < 0.05). The identified metabolites included in fruit set-associated modules with kME > 0.7 are shown. Fruit set-associated GenM–MetM subnetworks (SN-1, -2, and -3; Fig. 2C) and the metabolites included in the subnetworks are also shown.
Fig. 4.
Fig. 4.
Targeted mutagenesis of the homolog of Arabidopsis CNA and its effect on ovary growth and transcriptome. (A) The family of transcription factors that are included in the GenM1 module. (B) Target sites specified by sgRNA and the edited genome and amino acid sequences in the putative knockout plant (Slhb15a-ko)—with a stop codon at the 24th amino acid altered using the modified CRISPR-Cas9 system (target-activation induced cytidine deaminase [Target-AID]). The three functional domains (homeodomain [HD], START, and MEKHLA), their positions on the SlHB15A protein, and the putative truncated protein structure in Slhb15a-ko are shown. (C) Parthenocarpy exhibited in Slhb15a-ko. (D) Representative sections of the ovary walls 4 DAA for Poll and Unpoll. (EH) The thickness (E), number of cell layers (F), and mean cell size of internal (G) and external (H) mesocarp in the ovary wall 4 DAA. Values are means ± SEs of three independent ovaries. Asterisks in EH indicate significant differences from nongrowing unpollinated WT ovaries (Student’s t test, P < 0.05). (IL) Transcript correlations between parthenocarpic Slhb15a-ko ovaries and pollinated WT ovaries (I and K) or parthenocarpic pro ovaries 4 DAA (J and L). Scatterplots show the log2 fold changes of 18,775 commonly expressed genes (I and J) or 92 selected genes associated with central metabolism shown in SI Appendix, Fig. S7 (K and L) between unpollinated WT ovaries and pollinated WT, unpollinated Slhb15a-ko, or unpollinated pro ovaries. WT_4U and WT_4U′ indicate different batches of unpollinated WT ovaries analyzed together with pollinated WT and unpollinated procera (pro) ovaries or unpollinated Slhb15a-ko, respectively. DAA, days after anthesis; 4P, 4 DAA with pollination; 4U (4U′), 4 DAA without pollination; Poll, pollination; Unpoll, unpollinated.
Fig. 5.
Fig. 5.
Modeling of sugar metabolism in WT tomato and procera (pro) mutant ovaries during fruit set. Models were parameterized according to the data in SI Appendix, Table S3 and further optimized to fit the experimental data. (A) Fluxes of Suc uptake and Suc interconverting enzymes, expressed in µmol min−1 g−1 FW. The percentage of Suc cycling within the cytosol was calculated from the ratio between Suc synthesis and cleavage. The percentage of FBP cycling was calculated from the ratio between synthesis and hydrolysis. (B) Concentrations of each sugar within the cytosol (cyt) and the vacuole (vac), expressed in mM. The total sugar concentrations (Fru + Glc + Suc) in each compartment (cyt and vac) are also shown. (C and D) Sugar transport fluxes across the tonoplast (C) and transport capacities (Vmax) of the Suc and hexose carriers (D), expressed in µmol min−1 g−1 FW. The x axis represents DAA. Data are means ± SDs of the 200 best fits. Asterisks indicate significant differences from Student’s t tests (P < 0.05) between the WT and pro ovaries 0 DAA, and between unpollinated WT (dotted light green line) and fruit-growing ovaries (pollinated WT [continuous red line], unpollinated pro [dotted blue line], and pollinated pro [continuous sky-blue line]) ovaries 2 and 4 DAA. Neu-Inv, neutral invertase; Vac-Inv, vacuolar acid invertase; SuSy, sucrose synthase; SPS, sucrose-phosphate synthase; PFK, ATP phosphofructokinase; FBPase, fructose 1,6-bisphosphatase; Fru, fructose; Glc, glucose; Suc, sucrose; FBP, fructose 1,6-bisphosphate.
Fig. 6.
Fig. 6.
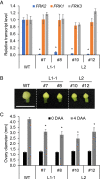
Silencing of FRK2 suppressed ovary growth during fruit set. (A) Expression analysis of three FK isozyme genes in the leaves of four individual plants (#7, #8, #10, and #12) derived from two independent transformed lines (L1-1 and L2). CAC gene was used as a reference and the expression levels of FRK genes were normalized to those of the WT. Values are mean ± standard error of three independent leaves. (B) Representative pictures and (C) diameter of the ovaries at 4 DAA, which were pollinated at 0 DAA with WT pollen. Diameter of unpollinated ovaries at 0 DAA are also shown in C. Values in C are mean ± standard errors of six replicates. (Scale bar in B, 1 cm.) Asterisks in A and C indicate significant differences from the corresponding WT (Student’s t test, P < 0.05).
Fig. 7.
Fig. 7.
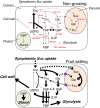
Model-assisted overview of the metabolic and compartment shifts of carbohydrates during tomato fruit set, as controlled by pollination and PROCERA. A fruit set model was constructed from the data for the enzyme fluxes and metabolite levels that were kinetically calculated, as shown in Fig. 5. Suc and hexose carriers are indicated with sky blue- and purple-colored circles, respectively. The enzyme fluxes and tonoplastic activities are correlated with the size of their circles, while the levels of metabolite accumulation are correlated with the size of their letter. Vacuole and plastid compartments are highlighted by orange and green, respectively. Arrows indicate reactions, while dashed arrows indicate translocations between the cytosol and plastid or vacuole. In nongrowing ovaries (i.e., at anthesis and unpollinated WT), the Suc cycle, as indicated by the SPS and SuSy fluxes, was highly active, leading to relatively high Suc content in the ovary. In the fruit-growing ovaries, significant accumulations of starch were observed with increased fluxes of Suc uptake via the symplast, Neu-Inv, FK, and GK at 2 DAA. Such fluxes were further activated 4 DAA, where fluxes of Vac-Inv, PGM, UGPase, PFK, cell wall synthesis, and glycolysis were also activated. Output fluxes are italicized. Neu-Inv, neutral invertase; Vac-Inv, vacuolar acid invertase; SuSy, sucrose synthase; SPS, sucrose-phosphate synthase; FK, fructokinase; GK, glucokinase; PGI, phosphoglucoisomerase; PGM, phosphoglycerate mutase; UGPase, UDP-glucose pyrophosphorylase; PFK, ATP phosphofructokinase; FBPase, fructose 1,6-bisphosphatase; Fru, fructose; Glc, glucose; Suc, sucrose; F6P, fructose-6-phosphate; G6P, glucose-6-phosphate; G1P, glucose-1-phosphate; UDPG, uracil-diphosphate glucose; FBP, fructose 1,6-bisphosphate.

Similar articles

Cited by

References

    1. Yamaguchi S., Gibberellin metabolism and its regulation. Annu. Rev. Plant Biol. 59, 225–251 (2008). - PubMed
    1. Sun T. P., Gibberellin-GID1-DELLA: A pivotal regulatory module for plant growth and development. Plant Physiol. 154, 567–570 (2010). - PMC - PubMed
    1. Ueguchi-Tanaka M., Nakajima M., Motoyuki A., Matsuoka M., Gibberellin receptor and its role in gibberellin signaling in plants. Annu. Rev. Plant Biol. 58, 183–198 (2007). - PubMed
    1. Bassel G. W., Mullen R. T., Bewley J. D., procera is a putative DELLA mutant in tomato (Solanum lycopersicum): Effects on the seed and vegetative plant. J. Exp. Bot. 59, 585–593 (2008). - PubMed
    1. Livne S. et al. ., Uncovering DELLA-independent gibberellin responses by characterizing new tomato procera mutants. Plant Cell 27, 1579–1594 (2015). - PMC - PubMed

Publication types

MeSH terms

LinkOut - more resources