. 2020 Dec;57(12):5336-5351.
doi: 10.1007/s12035-020-02099-7. Epub 2020 Sep 3.

The Epilepsy-Related Protein PCDH19 Regulates Tonic Inhibition, GABAAR Kinetics, and the Intrinsic Excitability of Hippocampal Neurons

Affiliations

The Epilepsy-Related Protein PCDH19 Regulates Tonic Inhibition, GABAAR Kinetics, and the Intrinsic Excitability of Hippocampal Neurons

Giulia M Serratto et al. Mol Neurobiol. 2020 Dec.

Abstract

PCDH19 encodes for protocadherin-19 (PCDH19), a cell-adhesion molecule of the cadherin superfamily preferentially expressed in the brain. PCDH19 mutations cause a neurodevelopmental syndrome named epileptic encephalopathy, early infantile, 9 (EIEE9) characterized by seizures associated with cognitive and behavioral deficits. We recently reported that PCDH19 binds the alpha subunits of GABAA receptors (GABAARs), modulating their surface availability and miniature inhibitory postsynaptic currents (mIPSCs). Here, we investigated whether PCDH19 regulatory function on GABAARs extends to the extrasynaptic receptor pool that mediates tonic current. In fact, the latter shapes neuronal excitability and network properties at the base of information processing. By combining patch-clamp recordings in whole-cell and cell-attached configurations, we provided a functional characterization of primary hippocampal neurons from embryonic rats of either sex expressing a specific PCDH19 short hairpin (sh)RNA. We first demonstrated that PCDH19 downregulation reduces GABAAR-mediated tonic current, evaluated by current shift and baseline noise analysis. Next, by single-channel recordings, we showed that PCDH19 regulates GABAARs kinetics without altering their conductance. In particular, GABAARs of shRNA-expressing neurons preferentially exhibit brief openings at the expense of long ones, thus displaying a flickering behavior. Finally, we showed that PCDH19 downregulation reduces the rheobase and increases the frequency of action potential firing, thus indicating neuronal hyperexcitability. These findings establish PCDH19 as a critical determinant of GABAAR-mediated tonic transmission and GABAARs gating, and provide the first mechanistic insights into PCDH19-related hyperexcitability and comorbidities.

Keywords: ASD; GABAAR; Hyperexcitability; Intellectual disability; PCDH19.


Conflict of interest statement

The authors declare that they have no competing interests.

Figures
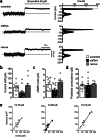
Fig. 1
Fig. 1
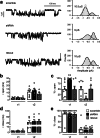
PCDH19 shRNA-mediated downregulation reduces the GABA tonic current in hippocampal neurons. a Left, representative current traces recorded from neurons expressing control shRNA (scramble), PCDH19 shRNA (shRNA), and shRNA + PCDH19 (rescue), showing the block of GABAAR tonic current upon bicuculline application (40 μM, gray bar), as inferred from the outward shift in the holding current. The dashed line indicates the holding current at baseline level, in the presence of GABA 0.1 μM. Right, corresponding all-points histograms before (baseline) and during bicuculline application. The mean current values of the two conditions, corresponding to the peaks of the Gaussian distribution, were used to calculate the current shift shown in b. b Histograms showing mean tonic current amplitude, calculated as the difference in the holding current before and during bicuculline application (bicuculline–baseline). ShRNA reduced tonic current by 55.8% with respect to scramble, while the rescue condition restored the tonic current to 115% of its control value (current shift amplitude, pA: scramble 65.731 ± 7.351, shRNA 29.707 ± 7.923, rescue 75.634 ± 14.305; one-way ANOVA, F (2, 29) = 5.496, p = 0.009; Dunnett’s post hoc test: scramble vs shRNA, *p = 0.029, DF = 29; scramble vs rescue, n.s., DF = 29; N = 10–12 neurons per condition from 3 different cultures). Error bars are mean ± SEM. c Histograms showing the current noise in scramble, shRNA, and rescue neurons expressed as the difference between the RMS noise in the baseline and the bicuculline condition. The RMS noise change was lower in shRNA compared to the other conditions (ΔRMS noise, pA: scramble 4.681 ± 0.557, shRNA 2.726 ± 0.627, rescue 5.405 ± 0.512; one-way ANOVA, F (2, 29) = 5.622, p = 0.008; Dunnett’s post hoc test: scramble vs shRNA, *p = 0.037, DF = 29; scramble vs rescue, n.s. p = 0.568, DF = 29; N = 10–12 neurons per condition from 3 different cultures). Error bars are mean ± SEM. d, e Prediction of GABAAR conductance based on noise variance analysis. Unitary channel conductance was estimated from the ratio between noise variance and mean tonic current (d) or from the slope of the lines representing the linear regression equation of data points obtained by plotting variance values against tonic current (e). No significant changes were observed in channel conductance. d Predicted single-channel conductance estimated from the ratio between noise variance and mean tonic current, pS: scramble 12.773 ± 1.243, shRNA 13.253 ± 2.216, rescue 14.149 ± 0.785; one-way ANOVA, F (2, 29) = 0.228, p = 0.797; N = 10–12 neurons per condition from 3 different cultures. e Predicted single-channel conductance estimated from the slope of the I tonic/variance linear regression equation, pS: scramble 12.76, shRNA 13.90, rescue 13.72; N = 9–12 neurons per condition from 3 different cultures. Slopes of the three regression lines were compared using one-way ANOVA (F (2,25) = 0.016, p = 0.983). Error bars are mean ± SEM
Fig. 2
Fig. 2
GABAAR single-channel conductance states are unaffected by PCDH19 downregulation. a I/V plots from somatic membrane patches of neurons at DIV11–15, previously transfected at DIV4 with scramble, shRNA, or rescue constructs, as indicated. Three different conductance states (low, mid, and high) are detectable in every condition, as can be inferred from the different slope of I/V curves, obtained from the linear regression equation of I/V values (N = 7–13 patches per condition from 3–5 independent cultures). Error bars are mean ± SEM. b Conductance states recorded from each patch. Patches were recorded from neurons transfected with scramble (white dots), shRNA (black dots), or rescue (gray dots). Patches can be classified according to the conductance states observed: most patches (56.3%) display low- and mid-conductance states, some patches (28.1%) display all three conductance states, and few patches (15.6%) display exclusively the low-conductance state. Solid lines indicate the mean conductance, while gray shadows indicate SEM (low conductance: 10.455 ± 0.233, N = 32; mid conductance: 18.596 ± 0.337, N = 27; high conductance 27.675 ± 0.797, N = 9; N indicates patches from three different conditions, 3–5 different cultures). c Representative single-channel openings from a control neuron (scramble condition), showing openings of different conductance states (from top to bottom: high, mid, and low). d Mean conductance values characterizing low, mid, and high conductance states for scramble (white bars), shRNA (black bars), and rescue (gray bars) neurons. PCDH19 downregulation does not affect single-channel conductance values (low conductance, pS: scramble 10.268 ± 0.416, N = 13; shRNA 10.688 ± 0.335, N = 12; rescue 10.403 ± 0.511, N = 7; one-way ANOVA, F (2, 29) = 0.310, p = 0.736; mid conductance, pS: scramble 18.154 ± 0.546, N = 11; shRNA 18.452 ± 0.692, N = 9; rescue 19.476 ± 0.337, N = 7; one-way ANOVA, F (2, 24) = 1.291, p = 0.293; high conductance, pS: scramble 29.14 ± 0.739, N = 3; shRNA 26.722 ± 1.31, N = 3; rescue 27.163 ± 1.922, N = 3; one-way ANOVA, F (2, 6) = 0.835, p = 0.479; N indicates number of patches, each patch coming from a distinct cell from 3–5 independent cultures). Error bars are mean ± SEM. e Relative proportion of conductance states within a single patch, showing no difference between scramble, shRNA, and rescue neurons. Patches showing two conductance states (low and mid) are plotted on the left side and analyzed separately from patches showing three conductance states (low, mid, and high) and plotted on the right (patches showing low + mid conductance states: low conductance, %: scramble 84.062 ± 3.578, N = 5; shRNA 76.855 ± 6.093, N = 5; rescue 83.021 ± 6.059, N = 4; one-way ANOVA, F (2, 11) = 0.568, p = 0.583; mid conductance, %: scramble 15.942 ± 3.578, N = 5; shRNA 23.145 ± 6.093, N = 5; rescue 16.979 ± 6.059, N = 4; one-way ANOVA, F (2, 11) = 0.568, p = 0.583; patches showing low + mid + high conductance states: low conductance, %: scramble 62.64 ± 2.541, N = 3; shRNA 52.437 ± 3.628, N = 3; rescue 50.285 ± 5.477, N = 3; one-way ANOVA, F (2, 6) = 2.635, p = 0.151; mid conductance, %: scramble 33.295 ± 2.222, N = 3; shRNA 35.624 ± 2.295, N = 3; rescue 38.810 ± 1.337, N = 3; one-way ANOVA, F (2, 6) = 1.917, p = 0.227; high conductance, %: scramble 4.062 ± 0.67, N = 3; shRNA 11.94 ± 4.119, N = 3; rescue 10.905 ± 4.171, N = 3; one-way ANOVA, F (2, 6) = 1.589, p = 0.281; N indicates number of patches, each patch coming from a distinct cell, from 3–5 independent preparations). Error bars are mean ± SEM
Fig. 3
Fig. 3
PCDH19 shRNA-mediated downregulation between DIV4 and DIV11–15 does not affect chloride reversal potential (ECl) in hippocampal neurons. a I/V plots from neurons at DIV4, DIV11–15, and DIV18. DIV4 and DIV18 neurons were untransfected, while DIV11–15 neurons had been transfected at DIV4 with scramble, shRNA, or rescue constructs. Solid lines represent fits of the linear regression equation. The inset shows magnification of line intersections with different membrane potential values, corresponding to ECl (N = 4–10 neurons per condition from 3 to 5 different cultures). Error bars are mean ± SEM. b Histogram showing ECl obtained by linear fitting of I/V plots from neurons at DIV11–15 transfected with scramble, shRNA, and rescue as indicated. PCDH19 downregulation does not change ECl value (ECl at DIV11–15, mV: scramble − 57.554 ± 3.257, N = 10; shRNA − 55.294 ± 3.504, N = 8; rescue − 58.178 ± 2.954, N = 4; one-way ANOVA, F (2, 19) = 0.171, p = 0.844; N indicates number of patches, each patch coming from a distinct cell from 3 to 5 different cultures). Error bars are mean ± SEM. c Histogram showing ECl obtained by linear fitting of I/V plots from untrasfected neurons at DIV4 and DIV18. The ECl is lower in DIV4 neurons compared to DIV18 neurons (ECl, mV: DIV4 − 49.95 ± 0.473, N = 4; DIV18 − 61.11 ± 4.033, N = 4; two-tailed unpaired Student’s t test, t = 2.748, DF = 6, *p = 0.033; N indicates number of patches, each patch coming from a distinct cell). Error bars are mean ± SEM
Fig. 4
Fig. 4
PCDH19 downregulation affects GABAAR kinetics. a Representative current traces of GABAAR single-channel low-conductance recordings evoked by 100 μM GABA (left) and relative current amplitude histograms fitted with Gaussian functions (right) in scramble, PCDH19 shRNA, and rescue hippocampal neurons. be Kinetic parameters of single-channel currents from neurons as in a. Time constants (b, d) and relative proportions (c, e) of the two exponential components (τ1 and τ2) that best represent the distribution of openings (b, c) and closures (d, e). In PCDH19 shRNA-expressing neurons, the relative contribution of short openings increases at the expense of that of long openings. Total number of patches recorded: scramble N = 9; shRNA N = 9; rescue N = 7. b τ1 open, ms: scramble 2.421 ± 0.433, N = 9; shRNA 2.860 ± 0.293, N = 9; rescue 2.353 ± 0.686, N = 6; one-way ANOVA F (2, 21) = 0.385, p = 0.685; τ2 open, ms: scramble 11.138 ± 1.893, N = 8; shRNA 13.221 ± 2.081, N = 7; rescue 8.422 ± 1.539, N = 6; one-way ANOVA F (2, 18) = 1.478, p = 0.254. c τ1 open, %: scramble 50.367 ± 11.436, N = 9; shRNA 94.322 ± 1.941, N = 9; rescue 48.871 ± 14.839, N = 7; τ2 open, %: scramble 49.618 ± 11.437, N = 9; shRNA 5.656 ± 1.934, N = 9; rescue 51.20 ± 14.87, N = 7; two-way ANOVA considering transfection and % of τ open as factors; transfection: F (2, 44) = 1.2e−5, p > 0.9999; % τ open: F (1, 44) = 12.06, p = 0.001; interaction F (2, 44) = 13.33, p < 0.0001; Dunnett’s post hoc test: % τ1 open, scramble vs shRNA, **p = 0.005, DF = 44; scramble vs rescue, n.s. p = 0.993, DF = 44; % τ2 open: scramble vs shRNA, **p = 0.005, DF = 44; scramble vs rescue, n.s. p = 0.992, DF = 44. d τ1 close, ms: scramble 1.982 ± 0.202, N = 9; shRNA 2.684 ± 0.304, N = 9; rescue 2.583 ± 0.522, N = 7; one-way ANOVA, F (2, 22) = 0.748, p = 0.485; τ2 close, ms: scramble 25.76 ± 8.503, N = 7; shRNA 32.190 ± 8.505, N = 8, rescue 31.90 ± 12.82, N = 5; one-way ANOVA, F (2, 17) = 0.149, p = 0.863. e τ1 close, %: scramble 85.667 ± 8.409, N = 9; shRNA 87.011 ± 4.211, N = 9; rescue 85.171 ± 5.387, N = 7; τ2 close, %: scramble 14.333 ± 8.409, N = 9; shRNA 12.989 ± 4.211, N = 9; rescue 14.829 ± 5.387, N = 7; two-way ANOVA considering transfection and % of τ close as factors; transfection: F (2, 44) = − 2.11e−14, p > 0.999; % τ close: F (1, 44) = 184.8, p < 0.0001; interaction: F (2, 44) = 0.044, p = 0.958. ae N indicates number of patches, each patch coming from a distinct cell from 3 to 5 different cultures; error bars are mean ± SEM
Fig. 5
Fig. 5
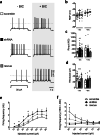
Hippocampal neurons in which PCDH19 is downregulated display increased excitability (scramble, white; shRNA, black; rescue, gray). a Representative traces of evoked spiking activity in hippocampal neurons expressing scramble, shRNA, and rescue constructs under basal condition (− BIC, left) and in the presence of 40 μM bicuculline (+ BIC, right). Spiking activity was evoked by 4-s squared pulse current injections (30 pA). Dotted gray lines represent 0 mV. b Quantification of RMP of neurons transfected as in a. Scramble, shRNA, and rescue neurons show no differences both under basal condition (− BIC, RMP, mV: scramble − 61.22 ± 0.802, shRNA − 58.41 ± 1.356, rescue − 59.76 ± 1.226; one-way ANOVA, F (2, 49) = 1.532, p = 0.226; N = 17–18 neurons per condition from 6 to 7 different cultures) and in the presence of bicuculline (+ BIC, RMP, mV: scramble − 56.50 ± 1.432, shRNA − 55.50 ± 1.258, rescue − 54.71 ± 1.409; one-way ANOVA, F (2, 20) = 0.358, p = 0.703; N = 6–10 neurons per condition from 3 different cultures). Error bars are mean ± SEM. c Histogram showing the input resistance (R input) measured as the slope of linear fits to the voltage responses during subthreshold current injections. Under basal condition, shRNA neurons display a significantly higher input resistance compared to scramble neurons, consistent with the decreased tonic current (− BIC , mean R input, mΩ: scramble 264.2 ± 23.87, shRNA 446.3 ± 50.91, rescue 336.9 ± 42.21; one-way ANOVA, F (2, 43) = 4.733, p = 0.013; Dunnett’s post hoc test: scramble vs shRNA, **p = 0.007, DF = 43; scramble vs rescue, n.s. p = 0.379, DF = 43; N = 14–16 neurons per condition from 6 to 7 different cultures). In the presence of bicuculline, no differences were observed between the three groups of neurons (+ BIC, mean R input, mΩ: scramble 461.3 ± 130.2, shRNA 421.8 ± 93.26, rescue 255.7 ± 43.05; one-way ANOVA, F (2, 19) = 1.049, p = 0.369; N = 6–10 neurons per condition from 3 different cultures). Error bars are mean ± SEM. d Quantification of rheobase current from neurons transfected as in a. Under basal condition, shRNA-expressing neurons, contrary to rescue neurons, are characterized by a reduced rheobase compared to scramble (− BIC, rheobase, pA: scramble 38.77 ± 2.879, shRNA 20.11 ± 2.374, rescue 32.10 ± 2.903; one-way ANOVA, F (2, 51) = 11.70, p < 0.0001; Dunnett’s post hoc test: scramble vs shRNA, ***p < 0.0001, DF = 51; scramble vs rescue, n.s. p = 0.159, DF = 51; N = 17–19 neurons per condition from 6 to 7 different cultures). In the presence of bicuculline, no differences were observed between the three groups of neurons (+ BIC, rheobase, pA: scramble 24.36 ± 5.310, shRNA 27.96 ± 4.469, rescue 33.30 ± 6.712; one-way ANOVA, F (2, 20) = 0.588, p = 0.564; N = 6–10 neurons per condition from 3 different cultures). Error bars are mean ± SEM. e Relationship between injected current and firing frequency of neurons transfected as in a under basal condition. Spiking activity was evoked by current steps starting from 0 pA up to 80 pA, in 10-pA increments. shRNA-expressing neurons, contrary to rescue neurons, display higher firing frequency compared to control neurons. Statistical significance is reached between 10 and 40 pA, and a trend was observed for the other current steps (firing frequency at 10 pA, Hz: scramble 0.000 ± 0.000, shRNA 0.234 ± 0.117, rescue 0.000 ± 0.000; one-way ANOVA, F (2, 46) = 4.115, p = 0.027; Dunnett’s post hoc test: scramble vs shRNA, *p = 0.0321, DF = 46; scramble vs rescue, n.s. p > 0.999, DF = 46; firing frequency at 20 pA, Hz: scramble 0.093 ± 0.093, shRNA 0.812 ± 0.217, rescue 0.441 ± 0.219; one-way ANOVA, F (2, 46) = 3.590, p = 0.035; Dunnett’s post hoc test: scramble vs shRNA, *p = 0.019, DF = 46; scramble vs rescue, n.s. p = 0.325, DF = 46; firing frequency at 30 pA, Hz: scramble 0.593 ± 0.292, shRNA 2.141 ± 0.480, rescue 1.176 ± 0.366; one-way ANOVA, F (2, 46) = 3.998, p = 0.025; Dunnett’s post hoc test: scramble vs shRNA, *p = 0.014, DF = 46; scramble vs rescue, n.s. p = 0.463, DF = 46; firing frequency at 40 pA, Hz: scramble 1.453 ± 0.470, shRNA 3.625 ± 0.8, rescue 1.956 ± 0.449; one-way ANOVA, F (2, 46) = 3.647, p = 0.033; Dunnett’s post hoc test: scramble vs shRNA, *p = 0.024, DF = 46; scramble vs rescue, n.s. p = 0.770, DF = 46; N = 14–17 neurons per condition from 6 to 7 different cultures). Error bars are mean ± SEM. f Firing frequency ratio between bicuculline and basal condition (+ BIC/− BIC) of neurons transfected as in a. ShRNA-expressing neurons, contrary to rescue neurons, display a lower firing frequency ratio compared to control neurons. Statistical significance is reached at 30 pA, and a trend was observed between 40 and 60 pA (firing frequency ratio at 30 pA: scramble 3.833 ± 1.144, shRNA 0.734 ± 0.292, rescue 2.017 ± 1.127; one-way ANOVA, F (2, 20) = 3.598, p = 0.046; Dunnett’s post hoc test: scramble vs shRNA, *p = 0.026, DF = 20; scramble vs rescue, n.s. p = 0.269, DF = 20; N = 6–10 neurons per condition from 3 different cultures). Error bars are mean ± SEM

Similar articles

Cited by

References

    1. Dibbens LM, Tarpey PS, Hynes K, Bayly MA, Scheffer IE, Smith R, Bomar J, Sutton E, Vandeleur L, Shoubridge C, Edkins S, Turner SJ, Stevens C, O'Meara S, Tofts C, Barthorpe S, Buck G, Cole J, Halliday K, Jones D, Lee R, Madison M, Mironenko T, Varian J, West S, Widaa S, Wray P, Teague J, Dicks E, Butler A, Menzies A, Jenkinson A, Shepherd R, Gusella JF, Afawi Z, Mazarib A, Neufeld MY, Kivity S, Lev D, Lerman-Sagie T, Korczyn AD, Derry CP, Sutherland GR, Friend K, Shaw M, Corbett M, Kim HG, Geschwind DH, Thomas P, Haan E, Ryan S, McKee S, Berkovic SF, Futreal PA, Stratton MR, Mulley JC, Gécz J. X-linked protocadherin 19 mutations cause female-limited epilepsy and cognitive impairment. Nat Genet. 2008;40:776–781. doi: 10.1038/ng.149. - DOI - PMC - PubMed
    1. Kolc KL, Sadleir LG, Scheffer IE, Ivancevic A, Roberts R, Pham DH, Gecz J. A systematic review and meta-analysis of 271 PCDH19-variant individuals identifies psychiatric comorbidities, and association of seizure onset and disease severity. Mol Psychiatry. 2018;24:241–251. doi: 10.1038/s41380-018-0066-9. - DOI - PMC - PubMed
    1. Smith L, Singhal N, El Achkar CM, Truglio G, Rosen Sheidley B, Sullivan J, Poduri A. PCDH19-related epilepsy is associated with a broad neurodevelopmental spectrum. Epilepsia. 2018;59:679–689. doi: 10.1111/epi.14003. - DOI - PMC - PubMed
    1. Kim SY, Chung HS, Sun W, Kim H. Spatiotemporal expression pattern of non-clustered protocadherin family members in the developing rat brain. Neuroscience. 2007;147:996–1021. doi: 10.1016/j.neuroscience.2007.03.052. - DOI - PubMed
    1. Kim SY, Mo JW, Han S, Choi SY, Han SB, Moon BH, Rhyu IJ, Sun W, Kim H. The expression of non-clustered protocadherins in adult rat hippocampal formation and the connecting brain regions. Neuroscience. 2010;170:189–199. doi: 10.1016/j.neuroscience.2010.05.027. - DOI - PubMed