. 2020 Sep 1;21(1):227.
doi: 10.1186/s12931-020-01491-0.

AKT2 drives cancer progression and is negatively modulated by miR-124 in human lung adenocarcinoma

Affiliations

AKT2 drives cancer progression and is negatively modulated by miR-124 in human lung adenocarcinoma

Ting Liu et al. Respir Res. .

Abstract

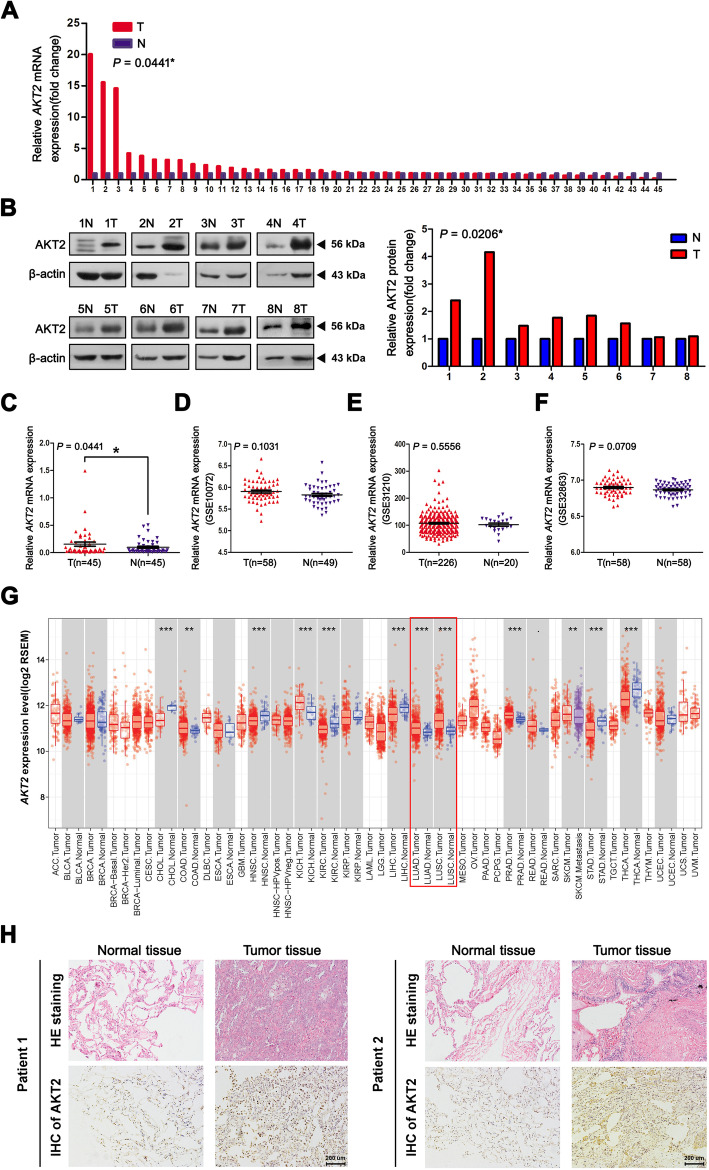
Background: AKT2 is highly expressed in many human cancers, including non-small cell lung cancer (NSCLC). Accumulating evidence has also revealed that AKT2 can promote NSCLC cell proliferation and metastasis. However, the involved mechanism remains unclear. Herein, our study mainly explored the function of AKT2 during cancer progression and uncovered a new post-transcriptional mechanism of AKT2 expression in lung adenocarcinoma (LUAD).

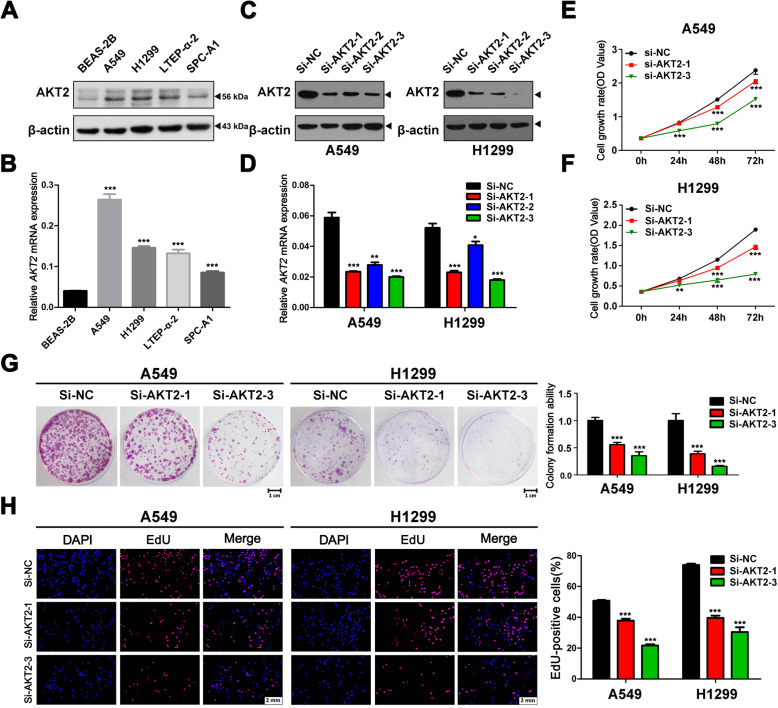
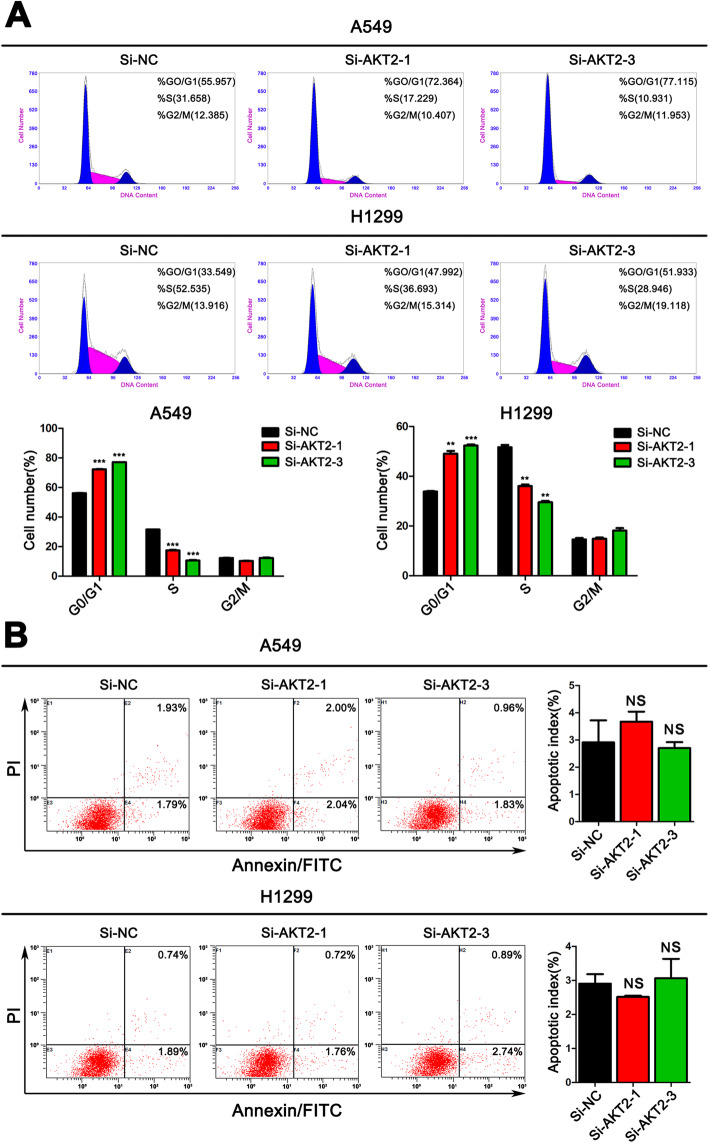
Methods: Quantitative real-time (qRT-PCR), western blot and immunohistochemistry (IHC) assays were performed to detect the expression of AKT2 and other proteins. Cell counting kit-8 (CCK-8), colony formation and EdU assays were performed to assess cell proliferation. Flow cytometry analysis was used to detect changes in the cell cycle and apoptosis. Transwell assays were used to evaluate cell migration and invasion. Additionally, a luciferase reporter assay and western blotting were employed to assess miR-124 targeting of AKT2. Xenograft mouse model was used to observe the role of miR-124/AKT2 axis on the occurrence and development of LUAD.

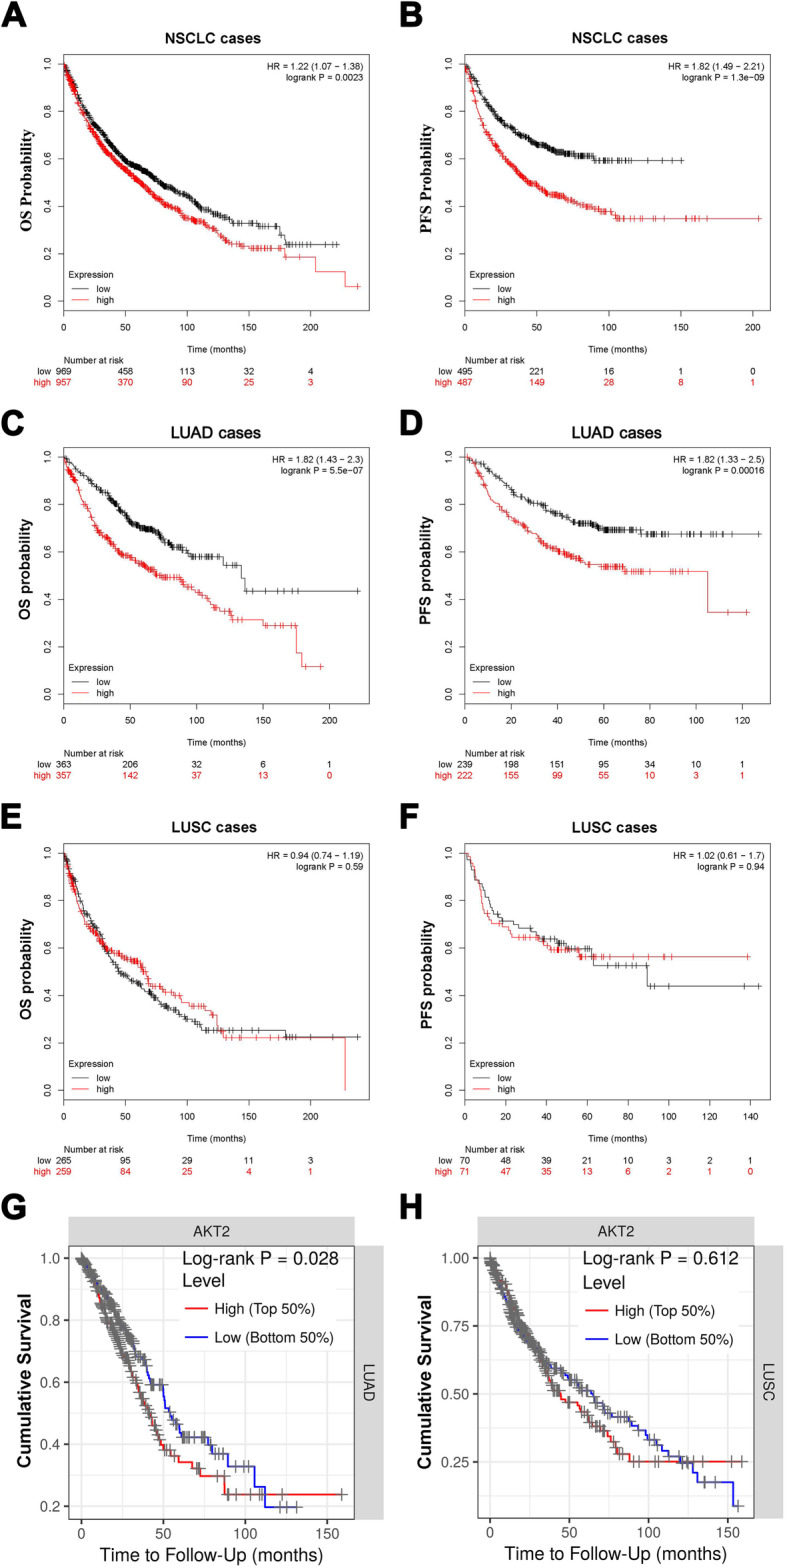
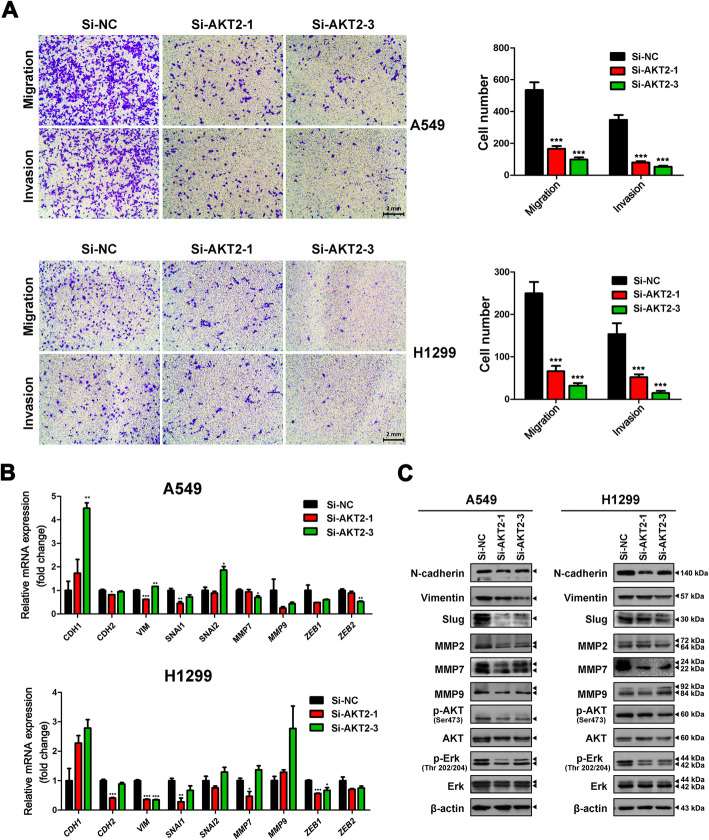
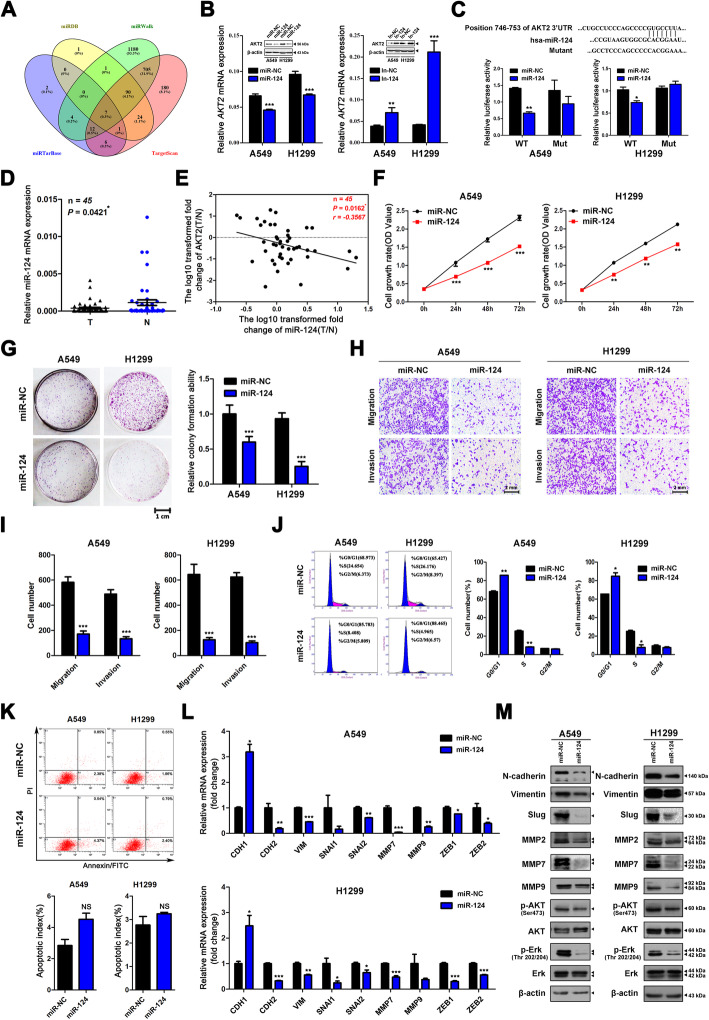
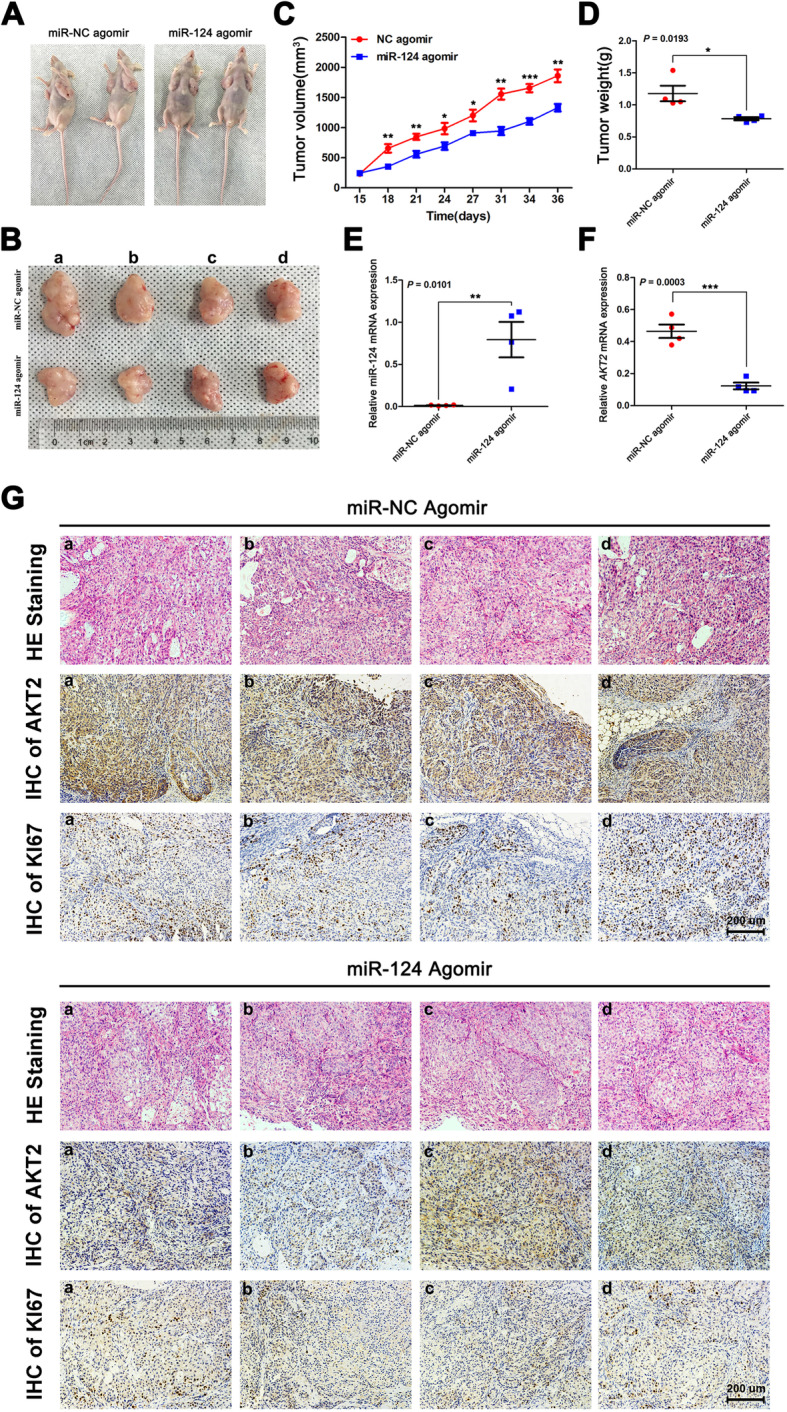
Results: We showed that AKT2 was highly expressed in NSCLC tissues and closely related to the poor prognosis of LUAD patients. Moreover, AKT2 affected LUAD cell proliferation, migration and invasion by regulating the cell cycle and promoting the occurrence of epithelial-mesenchymal transition (EMT) and the expression of matrix metalloproteinases (MMPs). In addition, we demonstrated that miR-124 overexpression downregulated AKT2 expression by binding to the 3'-untranslated region (3'- UTR) of AKT2 and thus inhibited the occurrence and development of LUAD in vivo and in vitro.

Conclusions: Our results suggest that miR-124 overexpression can negatively regulate AKT2 and thus inhibit the progression of LUAD. Therefore, the miR-124/AKT2 axis may serve as a potential target for novel therapies for LUAD.

Keywords: AKT2; Invasion; Lung adenocarcinoma; Migration; Proliferation; miR-124.


Conflict of interest statement

The authors declare no conflicts of interest.

Figures

Fig. 1
Fig. 1
AKT2 is overexpressed in human NSCLC tissues. (a and c) Relative quantification of AKT2 expression was analyzed by qRT-PCR assay in 45 NSCLC tissues (T) and adjacent noncancerous tissues (N). ACTB mRNA levels were used as internal control for normalization of AKT2 mRNA expression. b Western blot analysis was performed to detect the AKT2 protein expression in 8 selected NSCLC tissues and adjacent tissues (left) and the quantification of relative AKT2 protein levels were shown in histogram (right). β-actin was used as internal control. d-f The public datasets from GEO (GSE 10072, GSE 31210 and GSE 32863) were used to verify AKT2 mRNA levels in NSCLC. g The public data from TIMER database was used to detect AKT2 mRNA expression in both LUAD tissues and LUSC tissues. h Tissue and normal samples from randomly selected patients with NSCLC were either stained with Hematoxylin and eosin (HE) (upper, n = 2 per group) or immunohistochemically (IHC) stained with an AKT2 antibody (bottom, n = 2 per group). Scale bar, 200 um. T: NSCLC tumor tissues N: Adjacent normal tissues. *P < 0.05; **P < 0.01; ***P < 0.001
Fig. 2
Fig. 2
Up-regulated AKT2 expression is associated with poor prognosis in LUAD patients. a and b Kaplan-Meier plots from Kaplan-Meier plotter shows the correlation between AKT2 expression and overall survival (a) or progression-free survival in patients with NSCLC (b). c-f Kaplan-Meier plotter data set shows the correlation between AKT2 expression and the overall survival or progression-free survival in LUAD (c, d) and LUSC (e, f) patients. g and h Public data from TIMER database shows the correlation between AKT2 expression and overall survival in LUAD (g) and LUSC (h) patients. OS, overall survival; PFS, progression-free survival. *P < 0.05; **P < 0.01; ***P < 0.001
Fig. 3
Fig. 3
Knockdown of AKT2 significantly prevents cell proliferation in LUAD cell lines. a and b AKT2 levels were detected by western blot (a) and qRT-PCR (b) in multiple NSCLC cell lines. c and d A549 and H1299 cells were transfected with control siRNA or siRNA against AKT2, the effective knock down of AKT2 expression was validated by western blot (c) and qRT-PCR (d). e and f CCK-8 assay was performed to detect the cell growth in AKT2 silenced A549 (e) and H1299 (f) cells. g Colony formation abilities were detected in AKT2 silenced A549 and H1299 cells. Representative images of colonies for cell proliferation were shown (left). The colony numbers in AKT2 silenced cells were normalized to negative control (right). h An EdU staining assay was performed to determine the proliferation ability of AKT2 silenced A549 and H1299 cells (left). EdU-positive ratio were shown (right). Scale bar, 2 mm. Each experiment was performed in triplicate independently. Student’s t-test was used for statistical analysis and data are presented as the mean ± SD.*P < 0.05; **P < 0.01; ***P < 0.001
Fig. 4
Fig. 4
Silencing AKT2 attenuates the cell cycle progression of LUAD cells without affecting apoptosis. a Flow cytometry cell cycle analysis was performed in A549 and H1299 cells transfected with Si-NC, Si-AKT2–1 and Si-AKT2–3. The distribution (%) of G0/G1, S and G2/M phases are shown in the histograms (bottom). b Flow cytometry apoptosis assay was performed in A549 and H1299 cells transfected with Si-NC, Si-AKT2–1 and Si-AKT2–3. 48 h post-transfection, cells were harvested and stained with Annexin V/FITC and propidium iodide (PI). The percentage of apoptotic cells are shown in the right panel. The date values represent mean ± SD of three measurements independently. NS: no significance. *P < 0.05; **P < 0.01; ***P < 0.001
Fig. 5
Fig. 5
Depletion of AKT2 inhibits cell migration and invasion in LUAD cells. a AKT2-silenced A549 and H1299 cells were allowed to migrate through an 8-μM pore in Transwells. The migratory cells were stained and counted in at least three microscopic fields. Cells were then treated as above and allowed to invade through the matrigel-coated membrane in the transwell inserts. Invaded cells were stained and counted under a microscope. Representative images (left) and the migratory cell numbers (right) were shown. Scale bar, 2 mm. b The mRNA expression of CDH1, CDH2, VIM, SNAI1, SNAI2, MMP7, MMP9, ZEB1 and ZEB2 were detected by qRT-PCR in AKT2 silenced A549 (upper) and H1299 (bottom) cells. c The expression of N-cadherin, Vimentin, Slug, MMP2, MMP7, MMP9, AKT, p-AKT, Erk and p-Erk protein levels were examined by western blot in AKT2 silenced A549 (left) and H1299 (right) cells. Each experiment was performed in triplicate independently and values are expressed as mean ± SD. *P < 0.05 **P < 0.01 ***P < 0.001
Fig. 6
Fig. 6
MiR-124 directly binds to AKT2 3’UTR region and thus inhibits LUAD cell proliferation, migration and invasion. a Authoritative bioinformatic databases (miRDB, miRWalk, miRTarBase and TargetScan) were used to predict the putative miRNAs targeting AKT2. b After transfection with miR-124 mimics and miR-NC (left) or miR-124 inhibitor or inhibitor-NC (right) in A549 and H1299 cell lines, the mRNA and protein levels of AKT2 were analyzed by western blot and qRT-PCR assays. c Computational algorithms predict that AKT2 3’UTR region harbors a putative miR-124 binding site (upper). Reporter vector containing wild type AKT2 3’UTR fragment was constructed, and different mutation was then introduced into the potential miR-124 targeting site to obtain mutant type 3′UTR. The generated luciferase reporter plasmids were co-transfected with negative control (miR-NC) or miR-124 mimics into A549 and H1299 cells. The relative firefly luciferase activity was determined and normalized to the Renilla luciferase activity (bottom). d qRT-PCR analysis of miR-124 expression in 45 paired NSCLC tissues and adjacent normal tissues. e Kaplan-meier analysis was used to detect the correlation between miR-124 and AKT2 expression in 45 paired NSCLC tissues and adjacent normal tissues. miR-124 and AKT2 mRNA levels are normalized against U6 and β-actin, respectively. X and y axes represent the log10 transformed T/N expression ratios of miR-124 and AKT2 mRNA, respectively. f and g CCK8 (f) and colony formation (g) assays were used to determine the proliferation abilities of miR-124 mimics or negative control (Si-NC) transfected A549 and H1299 cells. h and i miR-124 overexpressed A549 and H1299 cells were allowed to migrate through an 8-μm pore or invade through matrigel-coated membrane in transwells. Migratory and invasive cells were stained and counted in at least three light microscopic fields. Representative images (h) and migratory or invasive cell numbers (i) were shown. Scale bar, 2 mm. j and k Flow cytometry cell cycle analysis of A549 and H1299 cell lines after miR-124 overexpression (left). The distribution (%) of G0/G1, S and G2/M phases are shown in the histograms (right). l and m Indicated EMT-related mRNAs (l) and proteins (m) were analyzed by qRT-PCR and western blot in miR-124 overexpressed A549 and H1299 cells. Each analysis was performed in triplicate and Values are represented as means ± SD.*P < 0.05 **P < 0.01 ***P < 0.001
Fig. 7
Fig. 7
MiR-124 inhibits tumor growth by targeting AKT2 in vivo. a and b 2 × 106 A549 cells were injected into nude mice (n = 2 mice per group). After tumor formation, miR-124 agomir and miR-NC agomir were injected into each tumor. Thirty-six days later, mice were euthanasia and tumors were surgically resected. Representative images of mice (a) and tumors (b) are shown. c The xenograft tumor volumes were measured every 2–3 days for total 36 days. Graph of tumor growth curves at the experimental endpoint. d Quantification of tumor weights from control and miR-124 agomir group. e and f qRT-PCR analysis of miR-124 and AKT2 mRNA expression in each excised tumor. U6 and ACTB were used as internal controls, respectively. g Representative images of H&E staining and IHC staining show tumor cells and the expression of AKT2 and KI67 in excised tumors from control or miR-124 agomir group. Scale bar, 200 um. *P < 0.05 **P < 0.01 ***P < 0.001

Similar articles

Cited by

References

    1. Siegel RL, Miller KD, Jemal A. Cancer statistics, 2019. CA Cancer J Clin. 2019;69:7–34. doi: 10.3322/caac.21551. - DOI - PubMed
    1. Herbst RS, Morgensztern D, Boshoff C. The biology and management of non-small cell lung cancer. Nature. 2018;553:446–454. doi: 10.1038/nature25183. - DOI - PubMed
    1. Mulshine JL, Sullivan DC. Clinical practice. Lung cancer screening. N Engl J Med. 2005;352:2714–2720. doi: 10.1056/NEJMcp042630. - DOI - PubMed
    1. Hers I, Vincent EE, Tavare JM. Akt signalling in health and disease. Cell Signal. 2011;23:1515–1527. doi: 10.1016/j.cellsig.2011.05.004. - DOI - PubMed
    1. Brazil DP, Hemmings BA. Ten years of protein kinase B signalling: a hard Akt to follow. Trends Biochem Sci. 2001;26:657–664. doi: 10.1016/S0968-0004(01)01958-2. - DOI - PubMed

MeSH terms