. 2020 Aug 29;12(9):2451.
doi: 10.3390/cancers12092451.

Extracellular Neuroglobin as a Stress-Induced Factor Activating Pre-Adaptation Mechanisms against Oxidative Stress and Chemotherapy-Induced Cell Death in Breast Cancer

Affiliations

Extracellular Neuroglobin as a Stress-Induced Factor Activating Pre-Adaptation Mechanisms against Oxidative Stress and Chemotherapy-Induced Cell Death in Breast Cancer

Marco Fiocchetti et al. Cancers (Basel). .

Abstract

Components of tumor microenvironment, including tumor and/or stromal cells-derived factors, exert a critical role in breast cancer (BC) progression. Here we evaluated the possible role of neuroglobin (NGB), a monomeric globin that acts as a compensatory protein against oxidative and apoptotic processes, as part of BC microenvironment. The extracellular NGB levels were evaluated by immunofluorescence of BC tissue sections and by Western blot of the culture media of BC cell lines. Moreover, reactive oxygen species (ROS) generation, cell apoptosis, and cell migration were evaluated in different BC cells and non-tumorigenic epithelial mammary cells treated with BC cells (i.e., Michigan Cancer Foundation-7, MCF-7) conditioned culture media and extracellular NGB. Results demonstrate that NGB is a component of BC microenvironment. NGB is released in tumor microenvironment by BC cells only under oxidative stress conditions where it can act as autocrine/paracrine factor able to communicate cell resilience against oxidative stress and chemotherapeutic treatment.

Keywords: 17β-Estradiol; apoptosis; breast cancer; docetaxel; neuroglobin; oxidative stress; stress adaptation and resistance; tumor microenvironment.


Conflict of interest statement

The authors declare no conflict of interest.

Figures
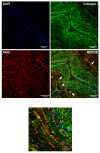
Figure 1
Figure 1
In vivo neuroglobin (NGB) extracellular localization. Confocal microscopy analysis of NGB and collagen I co-immuno-localization in human breast cancer tissue (ERα+; grade G2) sections. The sections were de-paraffinized, boiled in a microwave for antigen retrieval, blocked with 3% Bovine Serum Albumine (BSA) in Phosphate Buffered Saline (PBS) + Triton-X 100 0.5%, stained with 4’,6-Diamidino-2-Phenylindole (DAPI) for nuclei (blue), the anti-NGB (red) and anti-Collagen I antibodies (green) (original magnification 40×). Co-immunolocalization between NGB and collagen I fibers (yellow signals) is indicated by white arrows in merged image. The gray square refers to merged image detail reported on the bottom as a digital magnification. The scale bars are 100 µm/cm in the first 4 panels and 25 µm/cm in the enlarged panel at the bottom. All images are single planes and are representative of 10 independent experiments.
Figure 2
Figure 2
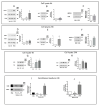
Effect of E2 and H2O2 stimulation on intracellular and extracellular NGB levels. Western blot images (left) and densitometric analysis (right) of intracellular (cell lysate) levels of pAKT(S473) (A,D), pS2 (B,E), HMOX-1 (C,F), and NGB (G,H) in MCF-7 treated with vehicle (EtOH/PBS 1/10 v/v), E2 (10 nM, 30 min), or H2O2 (200 μM; 30 min) as reported in Figure S1 and harvested 4 or 24 h after cell washing. The amount of protein was normalized by comparison with tubulin levels or with total AKT and tubulin levels (A,D). Western Blot representative images of NGB protein levels in conditioned media generated by E2 or H2O2 treated cells after 24 h of cell culturing (I). The level of NGB in MCF-7 cell lysates was used as positive control of NGB expression. The amount of protein was normalized by comparison with amphiregulin (AREG) protein levels. Evaluation of extracellular NGB levels through ELISA sandwich analysis in 24 h conditioned media (J). Data are means ± SD of at least three different experiments. p < 0.01 was determined with Student’s t-test vs. Veh condition (*) and vs. E2 treatment (°) (A). The whole blot images can be found in Figure S2.
Figure 3
Figure 3
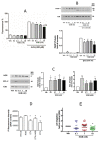
Effects of exogenous NGB on MCF-7 cell phenotype. (A) Reactive oxygen species (ROS) generation in MCF-7 cells pretreated with vehicle (EtOH/PBS 1/10 v/v), E2 (10 nM), or exogenous NGB (0.1, 1, and 10 nM) for 4 h and then exposed to H2O2 (400 μM; 30 min). Data are shown as percentage with respect to H2O2 treatment alone (100%). (B) Western blot (upper panel) and densitometric analyses (bottom panel) of PARP-1 cleavage in MCF-7 stimulated with vehicle (EtOH/PBS 1/10 v/v), E2 (10 nM) or exogenous NGB (0.1, 1, and 10 nM) (4 h) in presence or absence of following apoptotic stimulation with docetaxel (DTX; 100 nM; 48 h). (C) Representative Western blot (left) and densitometric analyses (right) of intracellular NGB and Bcl-2 protein levels in MCF-7 cells treated with vehicle (EtOH/PBS 1/10 v/v), E2 (10 nM) or exogenous NGB (0.1, 1, and 10 nM) for 48 h. The amount of protein was normalized by comparison with tubulin levels. (D) Analyses of MCF-7 cell DNA content obtained from propidium iodine assay (PI). Cells were stimulated with vehicle (EtOH/PBS 1/10 v/v) and exogenous NGB (10 nM) (4 h) in presence or absence of following apoptotic stimulation with docetaxel (DTX; 100 nM; 48 h). Data are means ± SD of at least three different experiments. p < 0.01 was determined with ANOVA followed by Tukey-Kramer post-test vs. Vehicle (*) or docetaxel (°) treatment. (E) Cell migration analysis of MCF-7 treated with vehicle (EtOH/PBS 1/10 v/v) or NGB (0.1, 1, and 10 nM) for 20 h. Data are means ± SD of at least three different experiments. p < 0.01 was determined with ANOVA followed by Tukey–Kramer post-test vs. Veh-H2O2 condition (*), vs. E2-H2O2 condition (°), vs. 0.1 nM NGB-H2O2 condition (#), vs. 1 nM NGB-H2O2 condition (§) (A) or Student’s t-test vs. Veh-DTX condition (*) (B) or vs. Veh treatment (*) (C,E). The whole blot images can be found in Figure S3.
Figure 4
Figure 4
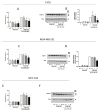
Effects of exogenous NGB on ERα +/− breast cancer and non-tumorigenic epithelial mammary cells. 2′,7′-Dichlorofluorescin diacetate (DCFHA-DA) analysis of ROS production in ERα+ T47D (A) ERα-MDA-MB-231 (C) breast cancer cells and non-tumorigenic epithelial mammary cells MCF-10A (E) pretreated for 4 h with a dose-curve of exogenous NGB (0.1, 1, and 10 nM) and then exposed to H2O2 (400 μM; 30 min). Data are shown as percentage respect to H2O2 treatment alone (100%). Analysis of PARP-1 cleavage in T47D (B), MDA-MB-231 (D), and MCF-10A (F) treated with exogenous NGB (0.1, 1, and 10 nM; 4 h pretreatment) in presence or absence of docetaxel (DTX; 100 nM; 48 h). The amount of protein was normalized by comparison with tubulin levels. Representative Western blots (left B,D,F) and densitometric analysis (right B,D) are reported. Data are means ± SD of at least three different experiments. p < 0.01 was determined with ANOVA followed by Tukey-Kramer post-test vs. Veh-H2O2 treatment (*) (A,C,E) or Student’s t-test vs. Veh-DTX (B,D) condition (*). The whole blots images can be found in Figure S4.
Figure 5
Figure 5
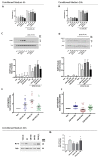
Effects of homotypic conditioned medium on MCF-7 cells phenotype. MCF-7 cells were treated in homotypic way with conditioned media obtained as reported in Figure S1 from MCF-7 cells stimulated with vehicle (EtOH/PBS 1/10 v/v), E2 (10 nM, 30 min), or H2O2 (200 μM; 30 min) and further cultured for 4 h (CM-Veh 4 h, CM-E2 4 h, CM-H2O2 4 h; left side) or 24 h (CM-Veh 24 h, CM-E2 24 h, CM-H2O2 24 h; right side). Effects of 4 h pretreatment conditioned media 4 h (CM 4 h) or 24 h (CM 24 h) on ROS generation in presence or absence of cells exposure to H2O2 (400 μM; 30 min) (A,B) and on PARP-1 cleavage in presence or absence of DTX stimulation (100 nM; 48 h) (C,D). E2 (10 nM; 4 h) pretreatment was used as positive control. In PARP-1 analysis, the amount of protein was normalized by comparison with tubulin levels. Upper panels are representative Western blots and bottom panels are corresponding densitometric analysis (C,D). Cell migration analysis of MCF-7 treated with conditioned media 4 h (E) or 24 h (F) for 20 h. Bcl-2 levels in MCF-7 treated with E2 (10 nM, 30 min), or conditioned media 24 h; left panel is the representative Western blot, right panel are the corresponding densitometric analysis (G). Data are means ± SD of at least three different experiments. p < 0.01 was determined with ANOVA followed by Tukey-Kramer post-test vs. Veh-H2O2 treated samples (*) (A,B) or Student’s t-test vs. Veh-DTX conditions (*) (C,D) or Veh treatment alone (*) (E,F,G). The whole blots images can be found in Figure S5.
Figure 6
Figure 6
Schematic model of NGB intracellular and extracellular localization after breast cancer cells exposure to E2 or H2O2. E2 cell treatment promotes intracellular re-localization of NGB mainly at mitochondrial compartments [7,17], whereas (present results) H2O2 induces the release of NGB into the extracellular milieu where the globin can act on ERα+/− breast cancer and in non-tumorigenic epithelial mammary cells reducing oxidative stress and/or chemotherapy induced apoptosis (see text for details).

Similar articles

Cited by

References

    1. Da Cunha B.R., Domingos C., Stefanini A.C.B., Henrique T., Polachini G.M., Castelo-Branco P., Tajara E.H. Cellular interactions in the tumor microenvironment: The role of secretome. J. Cancer. 2019;10:4574–4587. doi: 10.7150/jca.21780. - DOI - PMC - PubMed
    1. Bessone M.I.D., Gattas M.J., Laporte T., Tanaka M., Simian M. The tumor microenvironment as a regulator of endocrine resistance in breast cancer. Front. Endocrinol. 2019;10:547. doi: 10.3389/fendo.2019.00547. - DOI - PMC - PubMed
    1. Place A.E., Huh S.J., Polyak K. The microenvironment in breast cancer progression: Biology and implications for treatment. Breast Cancer Res. 2011;13:1–11. doi: 10.1186/bcr2912. - DOI - PMC - PubMed
    1. Mittal S., Brown N., Holen I. The breast tumor microenvironment: Role in cancer development, progression and response to therapy. Expert Rev. Mol. Diagn. 2018;18:227–243. doi: 10.1080/14737159.2018.1439382. - DOI - PubMed
    1. Amornsupak K., Insawang T., Thuwajit P., O-Charoenrat P., Eccles S.A., Thuwajit C. Cancer-associated fibroblasts induce high mobility group box 1 and contribute to resistance to doxorubicin in breast cancer cells. BMC Cancer. 2014;14:955. doi: 10.1186/1471-2407-14-955. - DOI - PMC - PubMed

LinkOut - more resources