Targeting Obesity-Induced Macrophages during Preneoplastic Growth Promotes Mammary Epithelial Stem/Progenitor Activity, DNA Damage, and Tumor Formation
- PMID: 32868380
- PMCID: PMC7572601
- DOI: 10.1158/0008-5472.CAN-20-0789
Targeting Obesity-Induced Macrophages during Preneoplastic Growth Promotes Mammary Epithelial Stem/Progenitor Activity, DNA Damage, and Tumor Formation
Abstract
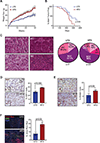
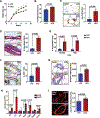
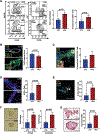
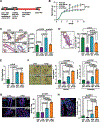
Obesity enhances breast cancer risk in postmenopausal women and premenopausal women with genetic or familial risk factors. We have shown previously that within breast tissue, obesity increases macrophage-driven inflammation and promotes expansion of luminal epithelial cell populations that are hypothesized to be the cells of origin for the most common subtypes of breast cancer. However, it is not clear how these changes within the microenvironment of the breast alter cancer risk and tumor growth. Using a high-fat diet to induce obesity, we examined preneoplastic changes associated with epithelial cell-specific loss of Trp53. Obesity significantly enhanced the incidence of tumors of diverse histotypes and increased stromal cells within the tumor microenvironment. Obesity also promoted the growth of preneoplastic lesions containing elevated numbers of luminal epithelial progenitor cells, which were surrounded by macrophages. To understand how macrophage-driven inflammation due to obesity enhances tumor formation, mice were treated with IgG or anti-F4/80 antibodies to deplete macrophages during preneoplastic growth. Unexpectedly, depletion of macrophages in obese mice enhanced mammary epithelial cell stem/progenitor activity, elevated expression of estrogen receptor alpha, and increased DNA damage in cells. Together, these results suggest that in obesity, macrophages reduce epithelial cells with DNA damage, which may limit the progression of preneoplastic breast lesions, and uncovers complex macrophage function within the evolving tumor microenvironment. Understanding how obesity alters the function of macrophages during tumor formation may lead to chemoprevention options for at-risk obese women. SIGNIFICANCE: Understanding how obesity impacts early tumor growth and response to macrophage-targeted therapies may improve therapeutics for obese patients with breast cancer and identify patient populations that would benefit from macrophage-targeted therapies.
©2020 American Association for Cancer Research.
Conflict of interest statement
Conflict of Interest Statement: The authors have no potential conflicts of interest to declare.
Figures


Similar articles
-
Obesity reduces mammary epithelial cell TGFβ1 activity through macrophage-mediated extracellular matrix remodeling.FASEB J. 2020 Jun;34(6):8611-8624. doi: 10.1096/fj.202000228RR. Epub 2020 May 2. FASEB J. 2020. PMID: 32359100 Free PMC article.
-
Obesity reversibly depletes the basal cell population and enhances mammary epithelial cell estrogen receptor alpha expression and progenitor activity.Breast Cancer Res. 2017 Nov 29;19(1):128. doi: 10.1186/s13058-017-0921-7. Breast Cancer Res. 2017. PMID: 29187227 Free PMC article.
-
Alterations in the mammary gland and tumor microenvironment of formerly obese mice.BMC Cancer. 2023 Dec 1;23(1):1183. doi: 10.1186/s12885-023-11688-3. BMC Cancer. 2023. PMID: 38041006 Free PMC article.
-
Mammary stem cells and progenitors: targeting the roots of breast cancer for prevention.EMBO J. 2019 Jul 15;38(14):e100852. doi: 10.15252/embj.2018100852. Epub 2019 Jun 21. EMBO J. 2019. PMID: 31267556 Free PMC article. Review.
-
Cytokine networks that mediate epithelial cell-macrophage crosstalk in the mammary gland: implications for development and cancer.J Mammary Gland Biol Neoplasia. 2014 Jul;19(2):191-201. doi: 10.1007/s10911-014-9319-7. Epub 2014 Jun 13. J Mammary Gland Biol Neoplasia. 2014. PMID: 24924120 Review.
Cited by
-
Macrophages Upregulate Estrogen Receptor Expression in the Model of Obesity-Associated Breast Carcinoma.Cells. 2022 Sep 12;11(18):2844. doi: 10.3390/cells11182844. Cells. 2022. PMID: 36139419 Free PMC article.
-
Obesity and Fibrosis: Setting the Stage for Breast Cancer.Cancers (Basel). 2023 May 26;15(11):2929. doi: 10.3390/cancers15112929. Cancers (Basel). 2023. PMID: 37296891 Free PMC article. Review.
-
Breast cancer microenvironment and obesity: challenges for therapy.Cancer Metastasis Rev. 2022 Sep;41(3):627-647. doi: 10.1007/s10555-022-10031-9. Epub 2022 Apr 18. Cancer Metastasis Rev. 2022. PMID: 35435599 Free PMC article. Review.
-
Gestational Intermittent Hypoxia Enhances Mammary Stem Cells and Alters Tumor Phenotype in Adult Female Offspring.Cells. 2024 Jan 29;13(3):249. doi: 10.3390/cells13030249. Cells. 2024. PMID: 38334641 Free PMC article.
-
Cancer metabolism and dietary interventions.Cancer Biol Med. 2021 Dec 22;19(2):163-74. doi: 10.20892/j.issn.2095-3941.2021.0461. Online ahead of print. Cancer Biol Med. 2021. PMID: 34931768 Free PMC article. Review.
References
-
- World Health Organization. Obesity and overweight fact sheet. 2016.
-
- Chun J, El-Tamer M, Joseph KA, Ditkoff BA, Schnabel F. Predictors of breast cancer development in a high-risk population. Am J Surg 2006;192:474–7 - PubMed
-
- Loi S, Milne RL, Friedlander ML, McCredie MR, Giles GG, Hopper JL, et al. Obesity and outcomes in premenopausal and postmenopausal breast cancer. Cancer Epidemiol Biomarkers Prev 2005;14:1686–91 - PubMed
Publication types
MeSH terms
Substances
Grants and funding
LinkOut - more resources
Full Text Sources
Medical
Research Materials

