. 2020 Nov 1;161(11):bqaa155.
doi: 10.1210/endocr/bqaa155.

Thyroid Hormone Induces DNA Demethylation in Xenopus Tadpole Brain

Affiliations

Thyroid Hormone Induces DNA Demethylation in Xenopus Tadpole Brain

Samhitha Raj et al. Endocrinology. .

Abstract

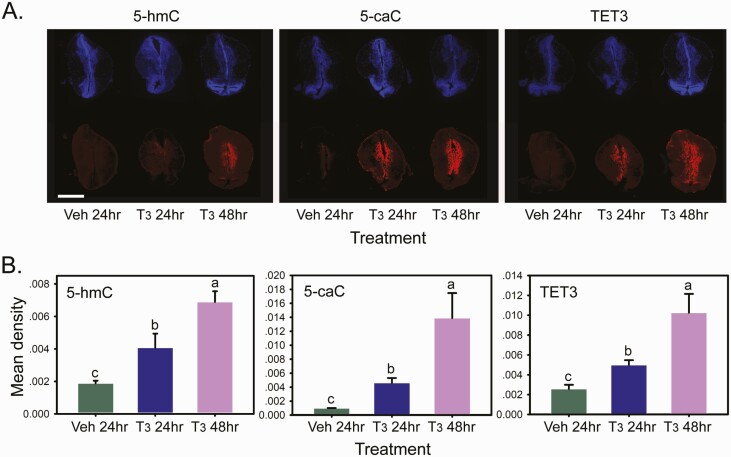
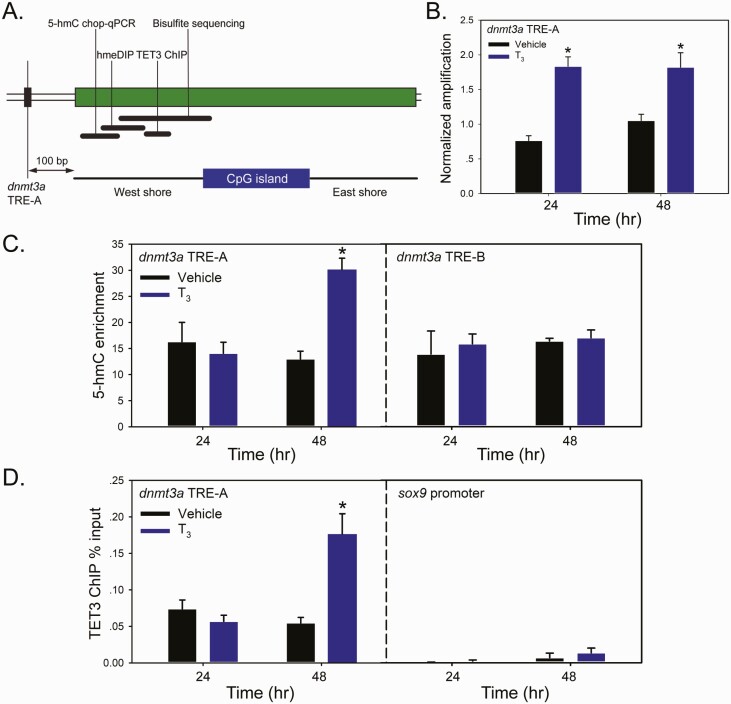
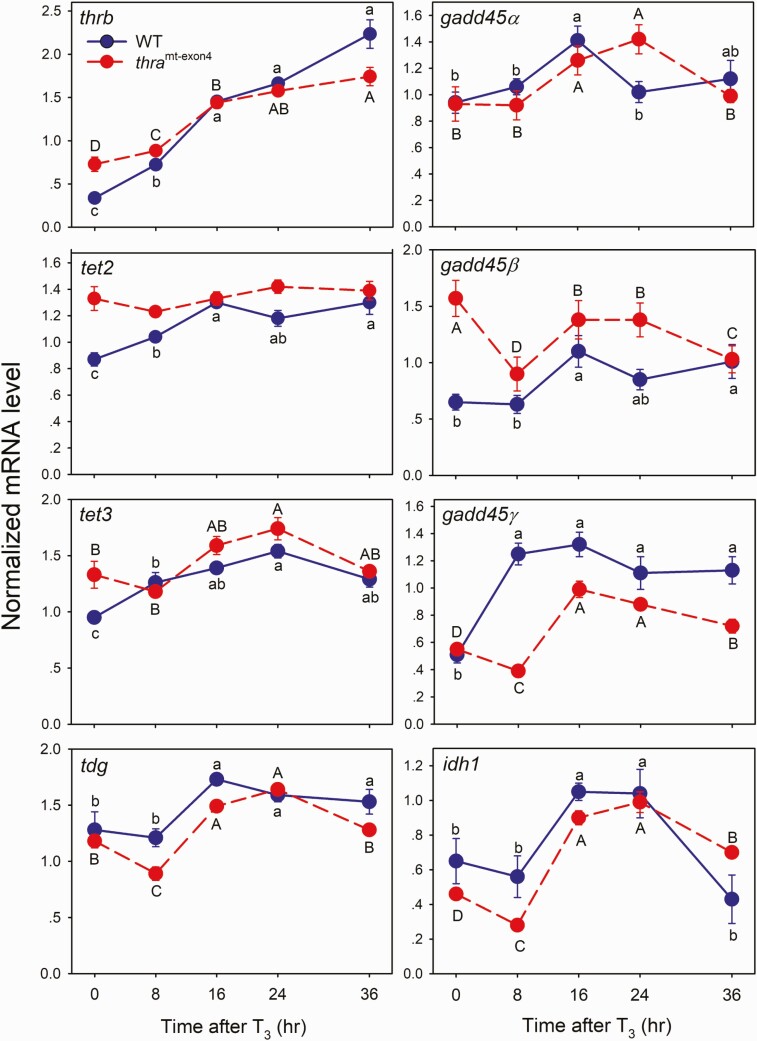
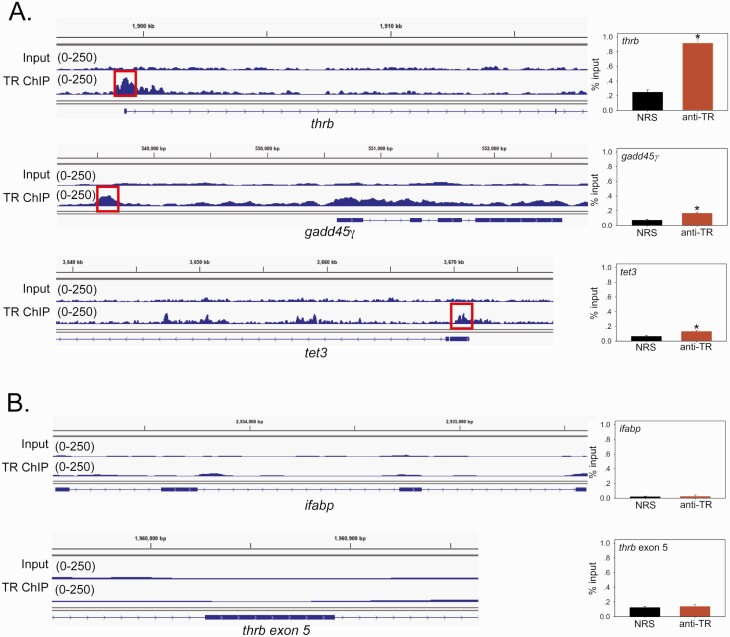
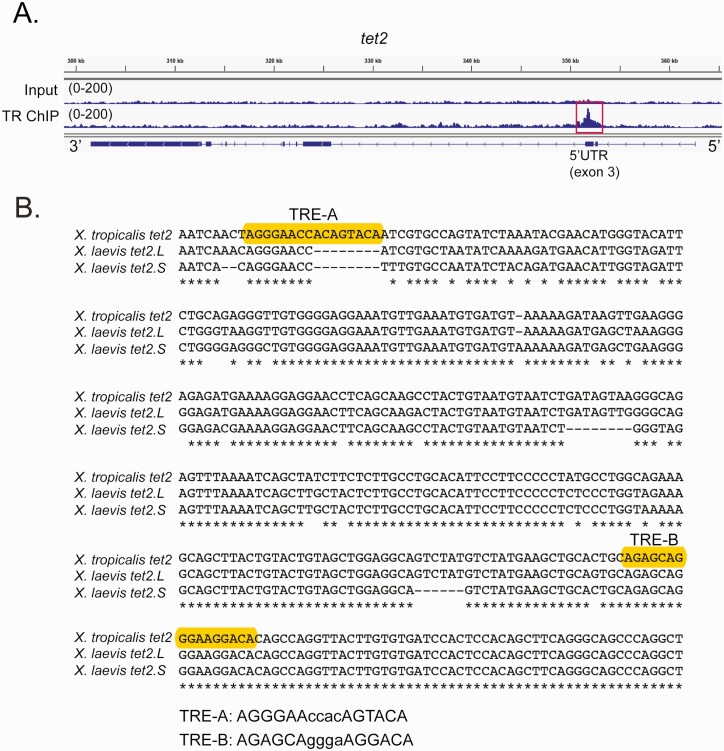
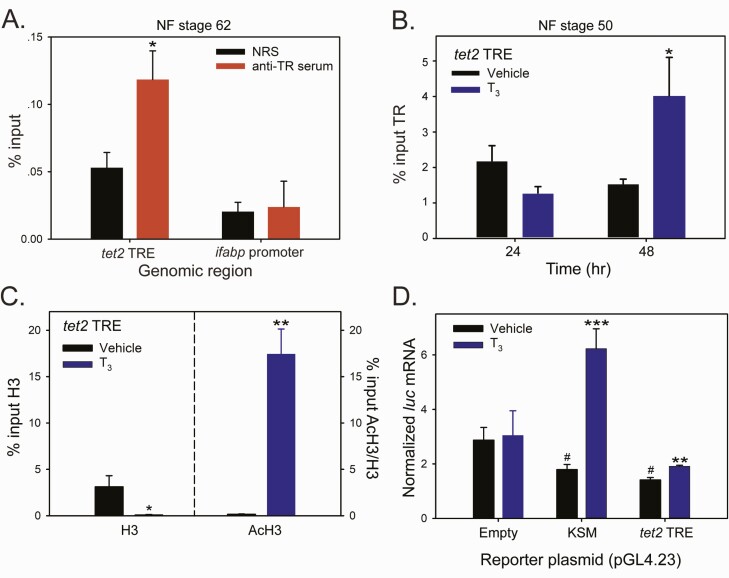
Thyroid hormone (T3) plays pivotal roles in vertebrate development, acting via nuclear T3 receptors (TRs) that regulate gene transcription by promoting post-translational modifications to histones. Methylation of cytosine residues in deoxyribonucleic acid (DNA) also modulates gene transcription, and our recent finding of predominant DNA demethylation in the brain of Xenopus tadpoles at metamorphosis, a T3-dependent developmental process, caused us to hypothesize that T3 induces these changes in vivo. Treatment of premetamorphic tadpoles with T3 for 24 or 48 hours increased immunoreactivity in several brain regions for the DNA demethylation intermediates 5-hydroxymethylcytosine (5-hmC) and 5-carboxylcytosine, and the methylcytosine dioxygenase ten-eleven translocation 3 (TET3). Thyroid hormone treatment induced locus-specific DNA demethylation in proximity to known T3 response elements within the DNA methyltransferase 3a and Krüppel-like factor 9 genes, analyzed by 5-hmC immunoprecipitation and methylation sensitive restriction enzyme digest. Chromatin-immunoprecipitation (ChIP) assay showed that T3 induced TET3 recruitment to these loci. Furthermore, the messenger ribonucleic acid for several genes encoding DNA demethylation enzymes were induced by T3 in a time-dependent manner in tadpole brain. A TR ChIP-sequencing experiment identified putative TR binding sites at several of these genes, and we provide multiple lines of evidence to support that tet2 contains a bona fide T3 response element. Our findings show that T3 can promote DNA demethylation in developing tadpole brain, in part by promoting TET3 recruitment to discrete genomic regions, and by inducing genes that encode DNA demethylation enzymes.

Keywords: DNA methylation; Xenopus; brain development; chromatin; metamorphosis; thyroid hormone.


Figures

Figure 1.
Figure 1.
Treatment with T3-induced time-dependent increases in immunoreactivity for the DNA demethylation intermediates 5-hmC and 5-caC, and the methylcytosine dioxygenase TET3 in premetamorphic tadpole brain. We treated premetamorphic (NF stage 50) X. tropicalis tadpoles with vehicle (Veh; 0.0003% DMSO) for 24 hours, or T3 (50 nM) for 24 or 48 hours (hr) added to the aquarium water before collecting and fixing brains for immunohistochemistry for 5-hmC, 5-caC, and TET3. A: Shown are representative micrographs of the region of the tadpole brain containing the thalamic nuclei and ventral hypothalamus (section K in Supplemental Fig. 1; abbreviations are defined in Supplemental Table 1) (62) stained with DAPI or with antibodies to the three different antigens, captured at 10x magnification. Scale bar = 0.5 mm. B: Densitometric analysis of 5-hmC, 5-caC, and TET3 immunoreactivity in tadpole brain after treatment with T3. Bars represent the mean ± SEM (n = 5–6/time point). Means with the same letter are not significantly different (one-way ANOVA; P < 0.05; Fisher’s LSD).
Figure 2.
Figure 2.
Treatment with T3 induced DNA demethylation and TET3 recruitment to chromatin in proximity to the TRE-A of the dnmt3a gene in premetamorphic tadpole brain. We treated premetamorphic (NF stage 50) X. tropicalis tadpoles with vehicle (0.0003% DMSO) or T3 (5 nM) added to the aquarium water for 24 or 48 hours (hr) before microdissecting and collecting the region of the brain containing the preoptic area/hypothalamus/thalamus for analysis by 5-hmC Chop-qPCR, hmeDIP, and TET3 ChIP assay. Bars represent the mean ± SEM (n = 4/time point). Data were analyzed by Student’s independent t-test, and asterisks indicate statistically significant differences between vehicle and T3-treated groups (P < 0.05). A: Schematic of the upstream region of the X. tropicalis dnmt3a gene showing the location of the DR+4 TRE-A (at 5.1 kb upstream of the TSS) (50) and the adjacent CpG island with “West” (5’) and “East” shores. This region is heavily methylated in premetamorphic tadpole brain, then becomes progressively demethylated during metamorphosis as the dnmt3a mRNA level increases (28). Black bars indicate the relative genomic locations targeted and size of amplicons for each of the three assays. Also shown for reference is the region that we analyzed using bisulfite sequencing that confirmed DNA demethylation during metamorphosis (28). B: Analysis of relative, locus-specific changes in 5-hmC content using 5-hmC Chop-qPCR assay. This assay provides a measure of enrichment of 5-hmC at a MspI restriction site within the genomic region indicated. C: Analysis of 5-hmC content using hmeDIP assay. We conducted 5-hmC immunoprecipitation for the hmeDIP assay using two methods with similar results (see the “Materials and Methods” section). D: Recruitment of TET3 to chromatin at the indicated genomic region analyzed by ChIP-qPCR assay. The TET3 ChIP signal is expressed as a percentage of the input.
Figure 3.
Figure 3.
Treatment with T3 caused time-dependent increases of mRNA levels of genes that encode DNA demethylation enzymes in premetamorphic tadpole brain. The action of T3 was impaired in tadpoles deficient for TRα (thramt-exon4). We treated WT or thramt-exon4 premetamorphic (NF stage 50–52) X. tropicalis tadpoles with T3 (5 nM) added to the aquarium water for the times indicated (hr - hour). We microdissected the region of the brain containing the preoptic area/thalamus/hypothalamus for RNA extraction and mRNA analysis by RT-qPCR. We normalized mRNA levels to the reference gene ef1α, which was unaffected by T3 treatment (data not shown). Points represent the mean ± SEM (n = 5/time point). We used one-way ANOVA [WT: thrb, F(4, 17) = 48.59, P < 0.0001; tet2, F(4, 18) = 12.18, P < 0.0001; tet3, F(4, 18) = 12.337, P < 0.0001; tdg, F(4, 19) = 8.49, P < 0.0001; gadd45α, F(4, 19) = 2.91, P = 0.049; gadd45β, F(4, 14) = 3.628, P = 0.31; gadd45γ, F(4, 19) = 20.72, P < 0.0001; idh1, F(4, 19) = 5.445, P = 0.004; thramt-exon4thrb, F(4, 19) = 64.19, P < 0.0001; tet2, P = 0.153; tet3, F(4, 17) = 8.539, P = 0.001; tdg, F(4, 16) = 46.38, P < 0.0001; gadd45α, F(4, 18) = 4.49, P = 0.011; gadd45β, P = 0.075; gadd45γ, F(4, 17) = 50.85, P < 0.0001; idh1, F(4, 18) = 53.622, P < 0.0001]. Means with the same letter within a genotype (WT, thramt-exon4) are not significantly different (Fisher’s LSD; P < 0.05).
Figure 4.
Figure 4.
Thyroid hormone receptors (TRs) associate in chromatin in metamorphic climax stage tadpole brain at genes that encode DNA demethylation enzymes. Shown are integrative genome viewer (IGV) genome browser tracks for TR ChIP-seq reads mapped to the X. tropicalis genome. We conducted a TR ChIP-seq experiment on chromatin isolated from the region of the preoptic area/thalamus/hypothalamus of metamorphic climax stage (NF stage 62) X. tropicalis tadpole brain. The input tracks are shown above the TR ChIP-seq tracks. Numbers in parentheses represent the scale for peak height. The gene structures are shown below the genome traces: lines and black filled bars represent introns and exons, respectively, and arrows indicate the direction 5’ → 3’. To the right of each genome track is a graph of a TR ChIP assay using normal rabbit serum (NRS; negative control) or rabbit antiserum to Xenopus TRs (anti-TR) that targeted the region covered by the TR ChIP-seq peak shown on the IGV genome browser track (indicated by the red box). The bars represent the mean ± SEM (n = 4). Asterisks indicate statistically significant differences between NRS and anti-TR serum (P < 0.05, Student’s independent t-test). A: IGV genome browser tracks and targeted TR ChIP assays at the thrb (XLOC_017285), gadd45γ (XLOC_017078.1), and tet3 (XLOC_025924) genes. The thrb gene, which has a TRE in its 5’ UTR (71, 72, 80), served as a positive control. The putative TRE region at gadd45γ is located 1.8 kb upstream of the TSS, and at tet3 it is in the 5’ UTR. B: IGV genome browser tracks and targeted TR ChIP assays at two negative control regions, the ifabp (XLOC_43086.1) gene and thrb exon 5.
Figure 5.
Figure 5.
Identification of putative TREs within the X. tropicalis tet2 gene. A: Genome browser tracks showing the location of a TR peak (red box) within the 5’ UTR (exon 3) of X. tropicalis tet2 (XLOC_002313) identified by TR ChIP-sequencing (see Supplemental Methods) (62) conducted on chromatin isolated from the whole brain of metamorphic climax stage (NF stage 62) tadpoles. Shown are genome tracks obtained with input and TR ChIP samples (numbers in parentheses indicate the peak height range). In the schematic under the genome browser tracks, the black boxes represent exons and the lines represent introns, and arrows on the gene indicate the orientation of the gene. B: Alignment of DNA sequences (5’ → 3’) within the third exons of X. tropicalis (358 bp) and X. laevis tet2 genes (located on chromosome 1 in both species; for X. laevis, which is pseudotetraploid, L – long chromosome, S – short chromosome). Accession numbers: X. tropicalis tet2 XM_012955515.3; X. laevis tet2.L LOC108710731; and X. laevis tet2.S LOC108706731. Shown are the locations of two predicted DR+4 TREs in X. tropicalis (only TRE-B is found in both species) identified using the sequence analysis program NHR-scan.
Figure 6.
Figure 6.
Thyroid hormone induced chromatin modifications at the putative X. tropicalis tet2 TRE region, and this genomic region supports T3-dependent transactivation. We conducted targeted qPCR-ChIP assays on chromatin isolated from whole brain of metamorphic climax stage (NF stage 62) tadpoles (panel A) or premetamorphic stage (NF stage 50) tadpoles (panel B) treated with vehicle (0.0003% DMSO) or T3 (5 nM) added to their aquarium water for different times. Bars represent the mean ± SEM (n = 4/treatment; experiments were repeated at least twice). Data were analyzed by Student’s independent t-test, and asterisks indicate statistically significant differences between NRS and anti-TR serum (panel A) or vehicle and T3-treated groups (panels B, C, and D; *P < 0.05, **P < 0.01, ***P < 0.001; # in panel D indicates statistically significant differences from vehicle-treated empty vector control; P < 0.0001). A: Targeted qPCR-ChIP assay confirmed TR association in chromatin at the tet2 5’ UTR in metamorphic climax stage tadpole brain. B: Targeted qPCR-ChIP assay showed increased TR ChIP signal at the tet2 5’ UTR in the brain of premetamorphic tadpoles treated with T3 for 48 hours (hr). C: Targeted qPCR-ChIP assays conducted on chromatin isolated from premetamorphic tadpole brain treated with T3 for 12 hours showed that T3 induced nucleosome repositioning at the tet2 5’ UTR, evidenced by a decrease in the H3 ChIP signal, and an open and active chromatin structure, evidenced by a large increase in the AcH3 ChIP signal (normalized to H3). There was no change in H3 or AcH3 at the ifabp promoter region after T3 treatment (data not shown). D: The 5’ UTR region of the X. tropicalis tet2 gene containing putative TREs (see Fig. 4) supports T3-dependent transactivation in transient transfection-reporter assays. We subcloned a 610 bp fragment of tet2 (Supplemental Table 2) (62) into the luciferase reporter vector pGL4.23 and transfected Neuro2a[TRβ1] cells with this vector (pGL4.23-tet2TRE), a vector containing the X. tropicalis klf9 synergy module (pGL4.23-KSM) or empty vector. Twenty hours after transfection, we treated cells with vehicle (0.01% DMSO) or T3 (30 nM) for 12 hours, then harvested for RNA isolation and analysis of luciferase (luc) mRNA by RT-qPCR.

Similar articles

Cited by

References

    1. Bernal J; Thyroid Hormones and Brain Development . Hormones, Brain and Behavior, Vol 5: Development of Hormone-Behavior Relationships. 3rd ed. Auger AP, Auger CJ, Pfaff DW, Joels M, eds. San Diego: Academic Press, Inc; 2017: 159-184.
    1. Porterfield SP, Hendrich CE. The role of thyroid hormones in prenatal and neonatal neurological development–current perspectives. Endocr Rev. 1993;14(1):94–106. - PubMed
    1. Shi Y-B Amphibian metamorphosis: from morphology to molecular biology. New York: Wiley-Liss; 2000.
    1. Vennstrom B, Liu H, Forrest D. Thyroid hormone receptors. In: Bunce CM, Campbell MJ, eds. Nuclear Receptors: Current Concepts and Future Challenges. New York, NY: Springer; 82010:183–201.
    1. Cheng SY, Leonard JL, Davis PJ. Molecular aspects of thyroid hormone actions. Endocr Rev. 2010;31(2):139–170. - PMC - PubMed

Publication types

MeSH terms