

Gadolinium Oxide Nanoparticles Induce Toxicity in Human Endothelial HUVECs via Lipid Peroxidation, Mitochondrial Dysfunction and Autophagy Modulation
- PMID: 32859033
- PMCID: PMC7559735
- DOI: 10.3390/nano10091675
Gadolinium Oxide Nanoparticles Induce Toxicity in Human Endothelial HUVECs via Lipid Peroxidation, Mitochondrial Dysfunction and Autophagy Modulation
Abstract
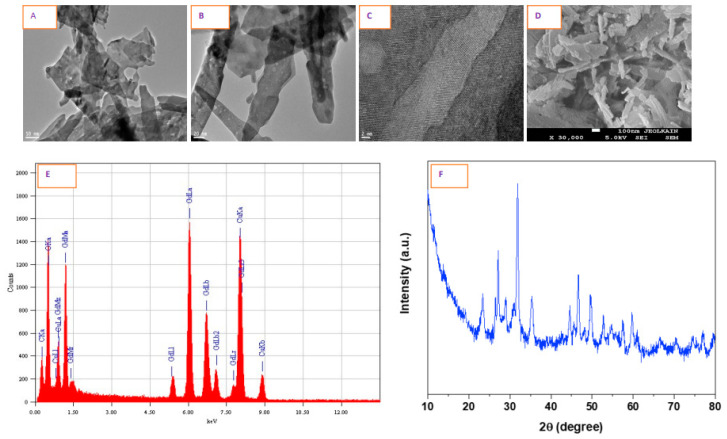
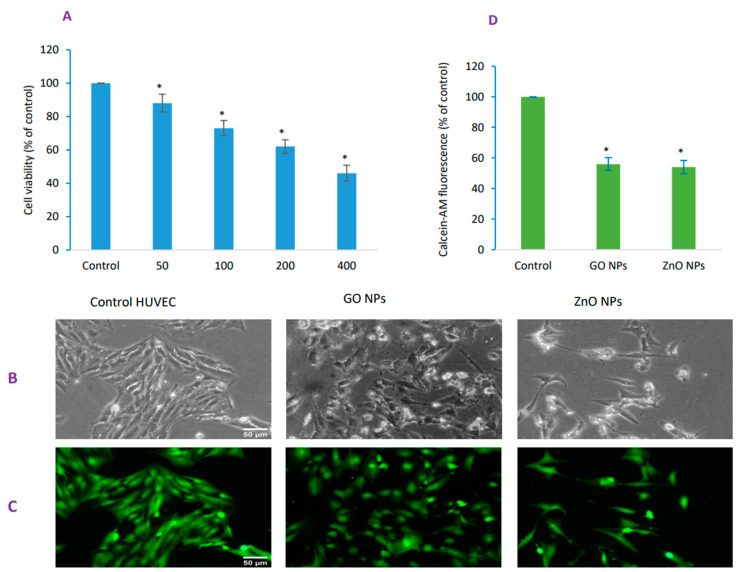
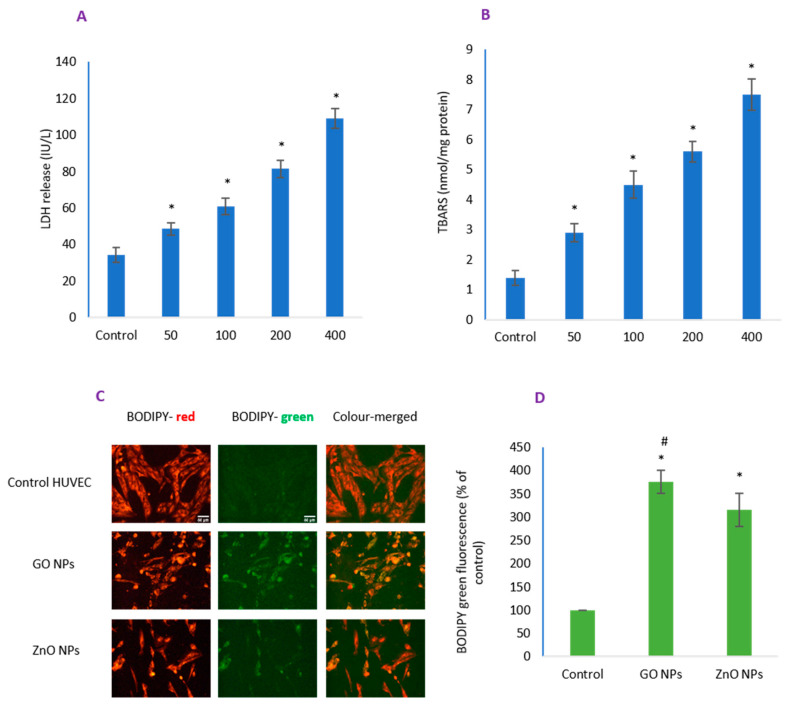
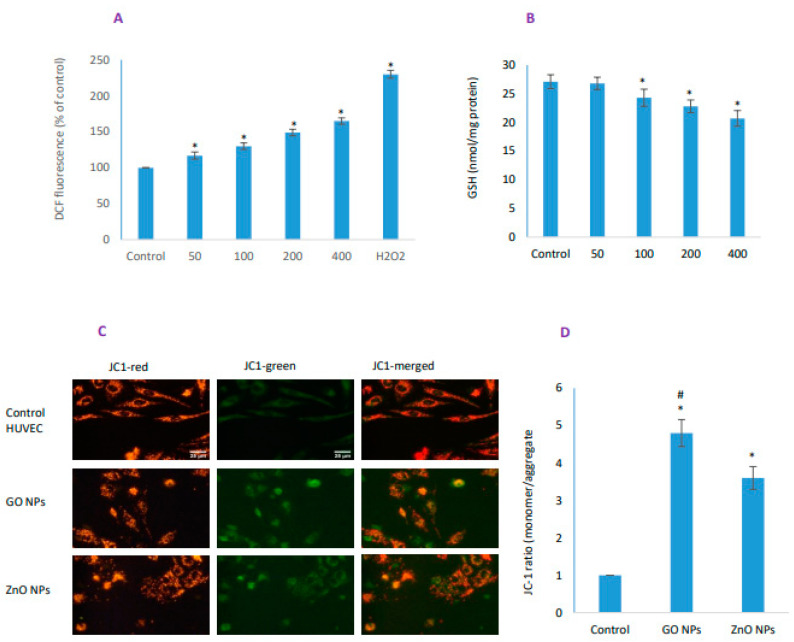
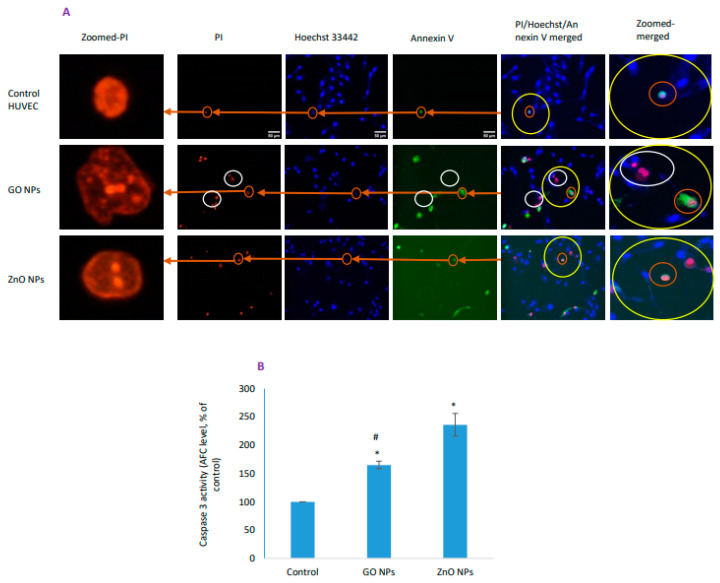
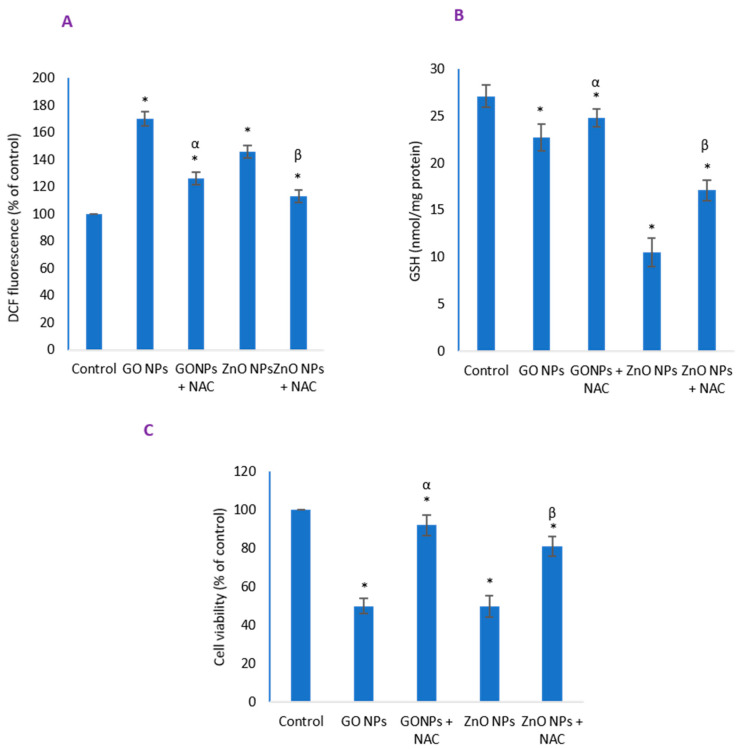
In spite of the potential preclinical advantage of Gd2O3 nanoparticles (designated here as GO NPs) over gadolinium-based compounds in MRI, recent concerns of gadolinium deposits in various tissues undergoing MRI demands a mechanistic investigation. Hence, we chose human to measure umbilical vein endothelial cells (HUVECs) that line the vasculature and relevant biomarkers due to GO NPs exposure in parallel with the NPs of ZnO as a positive control of toxicity. GO NPs, as measured by TEM, had an average length of 54.8 ± 29 nm and a diameter of 13.7 ± 6 nm suggesting a fiber-like appearance. With not as pronounced toxicity associated with a 24-h exposure, GO NPs induced a concentration-dependent cytotoxicity (IC50 = 304 ± 17 µg/mL) in HUVECs when exposed for 48 h. GO NPs emerged as significant inducer of lipid peroxidation (LPO), reactive oxygen species (ROS), mitochondrial membrane potential (MMP) and autophagic vesicles in comparison to that caused by ZnO NPs at its IC50 for the same exposure time (48 h). While ZnO NPs clearly appeared to induce apoptosis, GO NPs revealed both apoptotic as well as necrotic potentials in HUVECs. Intriguingly, the exogenous antioxidant NAC (N-acetylcysteine) co-treatment significantly attenuated the oxidative imbalance due to NPs preventing cytotoxicity significantly.
Keywords: ROS; autophagy; lysosome; necrosis; oxidative stress.
Conflict of interest statement
The authors declare no conflict of interest.
Figures

Similar articles
-
The effects of endoplasmic reticulum stress inducer thapsigargin on the toxicity of ZnO or TiO2 nanoparticles to human endothelial cells.Toxicol Mech Methods. 2017 Mar;27(3):191-200. doi: 10.1080/15376516.2016.1273429. Epub 2017 Jan 8. Toxicol Mech Methods. 2017. PMID: 27997269
-
Toxicity Mechanism of Gadolinium Oxide Nanoparticles and Gadolinium Ions in Human Breast Cancer Cells.Curr Drug Metab. 2019;20(11):907-917. doi: 10.2174/1389200220666191105113754. Curr Drug Metab. 2019. PMID: 31702485
-
Cytotoxicity, oxidative stress and inflammation induced by ZnO nanoparticles in endothelial cells: interaction with palmitate or lipopolysaccharide.J Appl Toxicol. 2017 Aug;37(8):895-901. doi: 10.1002/jat.3415. Epub 2016 Nov 15. J Appl Toxicol. 2017. PMID: 27862064
-
The endoplasmic reticulum stress inducer thapsigargin enhances the toxicity of ZnO nanoparticles to macrophages and macrophage-endothelial co-culture.Environ Toxicol Pharmacol. 2017 Mar;50:103-110. doi: 10.1016/j.etap.2017.01.020. Epub 2017 Jan 30. Environ Toxicol Pharmacol. 2017. PMID: 28171821
-
The use of human umbilical vein endothelial cells (HUVECs) as an in vitro model to assess the toxicity of nanoparticles to endothelium: a review.J Appl Toxicol. 2017 Dec;37(12):1359-1369. doi: 10.1002/jat.3470. Epub 2017 Apr 6. J Appl Toxicol. 2017. PMID: 28383141 Review.
Cited by
-
Enhanced Anticancer Performance of Eco-Friendly-Prepared Mo-ZnO/RGO Nanocomposites: Role of Oxidative Stress and Apoptosis.ACS Omega. 2022 Feb 15;7(8):7103-7115. doi: 10.1021/acsomega.1c06789. eCollection 2022 Mar 1. ACS Omega. 2022. PMID: 35252701 Free PMC article.
-
Apoptosis-mediated anti-proliferative activity of Calligonum comosum against human breast cancer cells, and molecular docking of its major polyphenolics to Caspase-3.Front Cell Dev Biol. 2022 Oct 10;10:972111. doi: 10.3389/fcell.2022.972111. eCollection 2022. Front Cell Dev Biol. 2022. PMID: 36299484 Free PMC article.
-
Titanium Dioxide Induces Apoptosis under UVA Irradiation via the Generation of Lysosomal Membrane Permeabilization-Dependent Reactive Oxygen Species in HaCat Cells.Nanomaterials (Basel). 2021 Jul 28;11(8):1943. doi: 10.3390/nano11081943. Nanomaterials (Basel). 2021. PMID: 34443774 Free PMC article.
-
Antioxidant, Anti-Proliferative Activity and Chemical Fingerprinting of Centaurea calcitrapa against Breast Cancer Cells and Molecular Docking of Caspase-3.Antioxidants (Basel). 2022 Aug 3;11(8):1514. doi: 10.3390/antiox11081514. Antioxidants (Basel). 2022. PMID: 36009233 Free PMC article.
-
ZnO Nanoparticles Induce Dyslipidemia and Atherosclerotic Lesions Leading to Changes in Vascular Contractility and Cannabinoid Receptors Expression as Well as Increased Blood Pressure.Nanomaterials (Basel). 2021 Sep 7;11(9):2319. doi: 10.3390/nano11092319. Nanomaterials (Basel). 2021. PMID: 34578635 Free PMC article.
References
Grants and funding
LinkOut - more resources
Full Text Sources
