Mefloquine Inhibits Esophageal Squamous Cell Carcinoma Tumor Growth by Inducing Mitochondrial Autophagy
- PMID: 32850358
- PMCID: PMC7400730
- DOI: 10.3389/fonc.2020.01217
Mefloquine Inhibits Esophageal Squamous Cell Carcinoma Tumor Growth by Inducing Mitochondrial Autophagy
Abstract
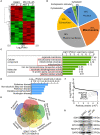
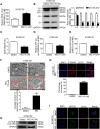
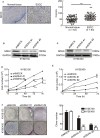
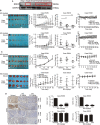
Esophageal squamous cell carcinoma (ESCC) has a worldwide impact on human health, due to its high incidence and mortality. Therefore, identifying compounds to increase patients' survival rate is urgently needed. Mefloquine (MQ) is an FDA-approved anti-malarial drug, which has been reported to inhibit cellular proliferation in several cancers. However, the anti-tumor activities of the drug have not yet been completely defined. In this study, mass spectrometry was employed to profile proteome changes in ESCC cells after MQ treatment. Sub-cellular localization and gene ontology term enrichment analysis suggested that MQ treatment mainly affect mitochondria. The KEGG pathway enrichment map of down-regulated pathways and Venn diagram indicated that all of the top five down regulated signaling pathways contain four key mitochondrial proteins (succinate dehydrogenase complex subunit C (SDHC), succinate dehydrogenase complex subunit D, mitochondrially encoded cytochrome c oxidase III and NADH: ubiquinone oxidoreductase subunit V3). Meanwhile, mitochondrial autophagy was observed in MQ-treated KYSE150 cells. More importantly, patient-derived xenograft mouse models of ESCC with SDHC high expression were more sensitive to MQ treatment than low SDHC-expressing xenografts. Taken together, mefloquine inhibits ESCC tumor growth by inducing mitochondrial autophagy and SDHC plays a vital role in MQ-induced anti-tumor effect on ESCC.
Keywords: autophagy; esophageal squamous cell carcinoma (ESCC); mefloquine (MQ); mitochondria; succinate dehydrogenase complex subunit C (SDHC).
Copyright © 2020 Xie, Zhang, Lu, Bao, Zhao, Lu, Wei, Yao, Jiang, Yuan, Zhang, Li, Chen, Dong and Liu.
Figures


Similar articles
-
Cloperastine inhibits esophageal squamous cell carcinoma proliferation in vivo and in vitro by suppressing mitochondrial oxidative phosphorylation.Cell Death Discov. 2021 Jun 21;7(1):166. doi: 10.1038/s41420-021-00509-w. Cell Death Discov. 2021. PMID: 34226508 Free PMC article.
-
Proteomics Reveal the Inhibitory Mechanism of Levodopa Against Esophageal Squamous Cell Carcinoma.Front Pharmacol. 2020 Sep 25;11:568459. doi: 10.3389/fphar.2020.568459. eCollection 2020. Front Pharmacol. 2020. PMID: 33101026 Free PMC article.
-
Green tea epigallocatechin gallate binds to and inhibits respiratory complexes in swelling but not normal rat hepatic mitochondria.Biochem Biophys Res Commun. 2014 Jan 17;443(3):1097-104. doi: 10.1016/j.bbrc.2013.12.110. Epub 2013 Dec 31. Biochem Biophys Res Commun. 2014. PMID: 24384371
-
DEPTOR suppresses the progression of esophageal squamous cell carcinoma and predicts poor prognosis.Oncotarget. 2016 Mar 22;7(12):14188-98. doi: 10.18632/oncotarget.7420. Oncotarget. 2016. PMID: 26893358 Free PMC article.
-
Autophagy as a cytoprotective mechanism in esophageal squamous cell carcinoma.Curr Opin Pharmacol. 2018 Aug;41:12-19. doi: 10.1016/j.coph.2018.04.003. Epub 2018 Apr 17. Curr Opin Pharmacol. 2018. PMID: 29677645 Free PMC article. Review.
Cited by
-
An In Silico and In Vitro Assessment of the Neurotoxicity of Mefloquine.Biomedicines. 2024 Feb 23;12(3):505. doi: 10.3390/biomedicines12030505. Biomedicines. 2024. PMID: 38540118 Free PMC article.
-
Pharmacology Progresses and Applications of Chloroquine in Cancer Therapy.Int J Nanomedicine. 2024 Jul 5;19:6777-6809. doi: 10.2147/IJN.S458910. eCollection 2024. Int J Nanomedicine. 2024. PMID: 38983131 Free PMC article. Review.
-
Ribonucleotide reductase small subunit M2 promotes the proliferation of esophageal squamous cell carcinoma cells via HuR-mediated mRNA stabilization.Acta Pharm Sin B. 2024 Oct;14(10):4329-4344. doi: 10.1016/j.apsb.2024.07.022. Epub 2024 Aug 3. Acta Pharm Sin B. 2024. PMID: 39525580 Free PMC article.
-
Oxethazaine inhibits esophageal squamous cell carcinoma proliferation and metastasis by targeting aurora kinase A.Cell Death Dis. 2022 Feb 25;13(2):189. doi: 10.1038/s41419-022-04642-x. Cell Death Dis. 2022. PMID: 35217647 Free PMC article.
-
Silencing of integrin subunit α3 inhibits the proliferation, invasion, migration and autophagy of esophageal squamous cell carcinoma cells.Oncol Lett. 2022 Jun 20;24(2):271. doi: 10.3892/ol.2022.13391. eCollection 2022 Aug. Oncol Lett. 2022. PMID: 35782901 Free PMC article.
References
LinkOut - more resources
Full Text Sources

