. 2020 Jul 28:11:1569.
doi: 10.3389/fimmu.2020.01569. eCollection 2020.

Disease Stage-Specific Pathogenicity of CD138 (Syndecan 1)-Expressing T Cells in Systemic Lupus Erythematosus

Affiliations

Disease Stage-Specific Pathogenicity of CD138 (Syndecan 1)-Expressing T Cells in Systemic Lupus Erythematosus

Lunhua Liu et al. Front Immunol. .

Abstract

CD138 (syndecan 1), a member of the heparan-sulfate proteoglycan family, regulates diverse biological responses by interacting with chemokines, cytokines, growth factors, and adhesion molecules. Expression of CD138 has been detected on T cells from both healthy and sick mice mimicking systemic lupus erythematosus (SLE) disease. However, the characteristics and the role of CD138+ T cells in SLE pathogenesis remain largely unknown. We analyzed the lupus-prone MRL/Lpr mice and the control MRL/MpJ strain as well as the common laboratory strains Balb/c, and C57BL/6 for CD138-expression and found that only the MRL/Lpr strain harbored TCRβ+CD138+ cells in various organs. The frequency of TCRβ+CD138+ cells progressively expanded in MRL/Lpr mice with age and correlated with disease severity. Majority of the TCRβ+CD138+ cells were CD4 and CD8 double-negative and 20% were CD4. At least a portion of TCRβ+CD138+ cells originated from CD4+ cells because substantial number of CD4+TCRβ+CD138- cells expressed CD138 after in vitro cultivation. Compared to TCRβ+CD138- cells, TCRβ+CD138+ cells exhibited central memory (Tcm) phenotype with reduced ability to proliferate and produce the cytokines IFNγ and IL-17. When co-cultured with B cells, the ability of TCRβ+CD138+ cells to promote plasma cell formation and autoreactive antibody production was dependent on the presence of autoantigen, CD4 co-receptor expression and cell-to-cell contact. Surprisingly, adoptively transferred TCRβ+CD138+ T cells slowed down disease progression in young recipient MRL/Lpr mice but had the opposite effect when DNA was co-administered with TCRβ+CD138+ T cells or when TCRβ+CD138+ cells were transferred to older MRL/Lpr mice with established disease. Thus, CD138-expressing T cells with Tcm phenotype enhance disease progression in SLE by rapidly activating autoreactive B cells when self-antigens are exposed to the immune system.

Keywords: MRL/Lpr mouse; T cells; immunopathogenesis; lupus; syndecan-1.


Figures

Figure 1
Figure 1
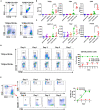
TCRβ+CD138+ cells populate the spleen, lymph nodes, thymus, and blood of MRL/Lpr mice, and their numbers increase with age. In each flow cytometry experiment TCRβ+CD138+ cells were quantified after gating out dead cells and CD19+ B cells. (A) Splenic TCRβ+CD138+ cells from 6 weeks old Balb/c, C57BL/6, MRL, and MRL/Lpr mice were quantified. Representative pseudocolor plots from each mouse strain are shown. Mean percentages ± SD of five mice from two independent experiments are plotted. Two-way ANOVA test was used to calculate statistical significance. The means of the four groups were statistically significantly different (p < 0.0001) in 2-way ANOVA test. Mann Whitney test was used to calculate the exact p-value for the comparisons between MRL/Lpr and other groups. (B) Splenic TCRβ+CD138+ cells from 4, 6, 14, to 26 weeks old MRL/Lpr mice were quantified. Representative pseudocolor plot from each time point is shown. Mean percentages ± SD of five to eight mice from three separate experiments are plotted. Two tailed Mann-Whitney rank sum test was used to calculate statistical significance. (C) TCRβ+CD138+ cells in bone marrow, thymus, spleen, lymph nodes, and blood of 14 weeks old MRL/Lpr mice were quantified. Representative pseudocolor plots from each organ are shown. Mean percentages ± SD of five mice from two independent experiments are plotted.
Figure 2
Figure 2
Most of the TCRβ+CD138+ cells are CD4 and CD8 negative while some derive from CD4+ T cells. (A) Splenocytes were harvested from 14 weeks old MRL/Lpr mice. After pre-gating live and single cells, TCRβ+CD138+ and TCRβ+138- cells were further analyzed for CD3, CD4, and CD8 expression by flow cytometry. Representative pseudocolor plots from out of five mice are shown. (B,C) Splenocytes were collected from 14 weeks old MRL/Lpr mice. CD19+ B cells, CD19+CD138- plasmablasts, CD19-CD138+ plasma cells, CD19-TCRβ+CD138- cells, and CD19-TCRβ+CD138+ cells were sorted by flow cytometry. The mRNA expression levels of cell surface molecules TCRβ, CD4, CD8 (B) and transcription factors GATA3, Tbet, and Foxp3 (C) were quantified in Q-PCR. Mean ± SD of five to six mice from three independent experiments are plotted. (D) Splenocytes were collected from 14 weeks old MRL/Lpr mice. After removing CD19+ B cells, TCRβ+CD138-, and TCRβ+CD138+ cells were sorted with magnetic beads and then cultured separately for 5 days. Frequencies of CD138-expressing TCRβ+ cells were quantified by flow cytometry. Representative pseudocolor plots are shown. Mean percentages ± SD of six mice from three independent experiments are plotted. (E) Splenocytes were collected from 14 weeks old MRL/Lpr mice. After removing CD19+ B cells, CD4+TCRβ+CD138-, and CD8+TCRβ+CD138- cells were sorted with magnetic beads and then cultured separately for 5 days. Frequencies of CD138-expressing CD4+ and CD8+ T cells were measured by flow cytometry. Mean percentages ± SD of six mice from three separate experiments are plotted. Two tailed Mann-Whitney rank sum test was used to calculate statistical significance.
Figure 3
Figure 3
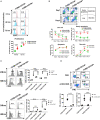
TCRβ+CD138+ cells proliferate less and resist early apoptosis after activation. (A) Splenic TCRβ+CD138+ and TCRβ+CD138- were sorted with magnetic beads and pre-stained with CSFE prior to stimulation with anti-CD3/CD28 antibodies for 3 days. The proliferation was assessed by flow cytometry. Representative histogram images are shown. Mean percentages ± SD of seven mice from three separate experiments are plotted. (B) Sorted splenic TCRβ+CD138+ and TCRβ+CD138- were stimulated for 4 days with anti-CD3/CD28 antibodies. Live, early apoptotic, apoptotic, and necrotic cells were measured by flow cytometry. Representative pseudocolor plots are shown. Mean percentages ± SD of six mice from three independent experiments are plotted. (C) Sorted splenic TCRβ+CD138+ and TCRβ+CD138- cells were activated with anti-CD3/CD28 antibodies for 24 or 48 h. Cells were stained with CD69 and CD25 antibodies to assess activation kinetics in flow cytometry. Representative histogram images indicating the frequency of positive cells are shown. Mean percentages ± SD of seven mice from three independent experiments are plotted. (D) Sorted splenic TCRβ+CD138+ and TCRβ+CD138- cells were activated with anti-CD3/CD28 antibodies for 16 h. Representative pseudocolor plots show intracellular IFNγ, and IL-17 staining. For each cytokine, mean ± SD of five mice are plotted. Two tailed Mann-Whitney rank sum test was used to calculate statistical significance.
Figure 4
Figure 4
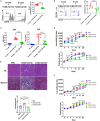
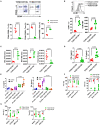
TCRβ+CD138+ cells are unable to promote lupus diseases development in young MRL/Lpr mice. (A–C) Sorted splenic TCRβ+CD138+ and TCRβ+CD138- cells from 10 to 12 weeks old MRL/Lpr mice were co-cultured with purified splenic B cells from 6 weeks old mice in the presence of anti-CD3/CD28 antibodies for 5 days. After gating-out TCRβ+ T cells, the proliferation of B cells (A) and the frequency of plasma cells (CD19intCD138+) (B) were measured by flow cytometry. Mean ± SD of 10 mice (A) or six mice (B) from three independent experiments are plotted. (C) Culture supernatants from the above co-culture experiment were analyzed for total IgM and IgG concentrations by ELISA. Mean ± SD of 10 mice from three independent experiments are plotted. (D,E) Splenic TCRβ+CD138+ and TCRβ+CD138- cells were sorted from 10 to 12 weeks old MRL/Lpr mice and then adoptively transferred into 7 to 8 weeks old MRL/Lpr mice without disease symptoms. (D) Autoreactive IgG antibody (dsDNA) and proteinuria levels were measured on indicated days. Mean ± SEM of 15 mice from three independent experiments are plotted. (E) Kidneys were collected 2 weeks after the transfer of cells and histopathological evaluations were performed on H&E and Masson stained specimens. Average pathology scores of 10 mice from two separate experiments are plotted. (F) Splenic TCRβ+CD138+ and TCRβ+CD138- cells were sorted from 10 to 12 weeks old MRL/Lpr mice and then adoptively transferred into 11 to 12 weeks old MRL/Lpr mice with existing disease symptoms. Autoreactive IgG antibody (dsDNA) and proteinuria levels were measured on indicated days. Mean ± SEM of 10 mice from two independent experiments are plotted. Two tailed Mann-Whitney rank sum test was used to calculate statistical significance.
Figure 5
Figure 5
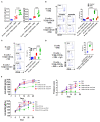
TCRβ+CD138+ cells activate autoreactive B cells when auto-antigens are included in the culture. (A–D) Sorted splenic TCRβ+CD138+ and TCRβ+CD138- cells from 12 weeks old MRL/Lpr mice were co-cultured with purified splenic B cells from the same mice for 5 days. (A) DNA was included in the co-cultured cells and culture supernatant anti-dsDNA IgM and IgG antibodies were measured by ELISA. Mean ± SD of six mice from three independent experiments are plotted. (B) T and B cells were incubated as mixed (contact) or separated with Transwell® (separate) in the presence of DNA. After gating-out TCRβ+ T cells, the differentiation of B cells into plasma cells (CD19intCD138+) was quantified by flow cytometry. Mean percentages ± SD of six mice from three independent experiments are plotted. (C) SM was included in the co-cultured cells and differentiation of B cells into plasma cells (CD19intCD138+) were quantified by flow cytometry after gating-out TCRβ+ T cells. Mean percentages ± SD of six mice from three experiments are plotted. (D) Cells were incubated in the presence of antibody against CD4 or control IgG and the differentiation of B cells into plasma cells was quantified by flow cytometry. Mean percentages ± SD of three independent experiments are plotted. (E) Splenic TCRβ+CD138+ and TCRβ+CD138- cells from 10 to 12 weeks old MRL/Lpr mice were sorted and then adoptively transferred into 5 to 6 weeks old MRL/Lpr mice with or without DNA. Mice that received PBS or DNA only served as control. Serum anti-dsDNA IgG and IgM antibody as well as proteinuria levels at indicated days were measured. Mean ± SEM of five mice are plotted. Two tailed Mann-Whitney rank sum test was used to calculate statistical significance.
Figure 6
Figure 6
CD138+ T cells exhibit central memory T cell phenotype. (A,B) Splenocytes were collected from 12 weeks old MRL/Lpr mice. (A) The expression of CD44 and CD62L on TCRβ+CD138- and TCRβ+CD138+ cells were measured by flow cytometry. Representative pseudocolor plots are shown. Mean percentages ± SD of five mice from two separate experiments are plotted. (B) Representative flow cytometry histogram of CCR7 expression on TCRβ+CD138- and TCRβ+CD138+ cells are shown. Mean ± SD percentages and MFIs for CCR7 expression from six mice in two separate experiments are plotted. (C) Splenic TCRβ+CD138+ and TCRβ+CD138- cells were sorted from 12 weeks old MRL/Lpr mice and BCL-6, Bim1, and Prdm1 mRNA were quantified by Q-PCR. Mean ± SD values of five mice from two separate experiments are plotted. (D) Splenic TCRβ+CD138+ and TCRβ+CD138- cells were sorted from 12 weeks old MRL/Lpr mice and cultured with anti-CD3/CD28 antibodies overnight. Culture supernatant IFNγ and IL-2 levels were measured by ELISA. Mean ± SD of nine mice from three independent experiments are plotted. (E) Splenic TCRβ+CD138+, TCRβ+CD138- cells were sorted from 12 weeks old MRL/Lpr mice and co-cultured with sorted B cells from the same mice in the presence of DNA for 3 days. Culture supernatant IFNγ and IL-2 levels were measured by ELISA. Mean ± SD of five mice from two separate experiments are plotted. (F) Cells were collected from spleen, lymph nodes, and bone marrows of 12 weeks old MRL/Lpr mice. Frequencies of Tcm (CD44+CD62L+) and Tem (CD44+CD62L-) cells among TCRβ+CD138- and TCRβ+CD138+ cells were measured in flow cytometry. Mean percentages ± SD of five mice from two independent experiments are plotted. (G) Splenocytes were collected from 12 weeks old Balb/c, C57BL/6, and MRL/Lpr mice. Frequencies of Tcm (CD44+CD62L+) and Tem (CD44+CD62L-) cells among TCRβ+CD138- and TCRβ+CD138+ cells were measured in flow cytometry. Mean percentages ± SD of five mice from two independent experiments are plotted. Two tailed Mann-Whitney rank sum test was used to calculate statistical significance.

Similar articles

Cited by

References

    1. Tsokos GC. Systemic lupus erythematosus. N Engl J Med. (2011) 365:2110–21. 10.1056/NEJMra1100359 - DOI - PubMed
    1. Suarez-Fueyo A, Bradley SJ, Tsokos GC. T cells in systemic lupus erythematosus. Curr Opin Immunol. (2016) 43:32–38. 10.1016/j.coi.2016.09.001 - DOI - PMC - PubMed
    1. Akahoshi M, Nakashima H, Tanaka Y, Kohsaka T, Nagano S, Ohgami E, et al. . Th1/Th2 balance of peripheral T helper cells in systemic lupus erythematosus. Arthritis Rheum. (1999) 42:1644–8. 10.1002/1529-013119990842:81644::AID-ANR123.0.CO;2-L - DOI - PubMed
    1. Koga T, Ichinose K, Tsokos GC. T cells and IL-17 in lupus nephritis. Clin Immunol. (2017) 185:95–99. 10.1016/j.clim.2016.04.010 - DOI - PMC - PubMed
    1. Linterman MA, Rigby RJ, Wong RK, Yu D, Brink R, Cannons JL, et al. . Follicular helper T cells are required for systemic autoimmunity. J Exp Med. (2009) 206:561–76. 10.1084/jem.20081886 - DOI - PMC - PubMed

MeSH terms