. 2020 Jul 22:14:766.
doi: 10.3389/fnins.2020.00766. eCollection 2020.

Role of Spinal Cord Akt-mTOR Signaling Pathways in Postoperative Hyperalgesia Induced by Plantar Incision in Mice

Affiliations

Role of Spinal Cord Akt-mTOR Signaling Pathways in Postoperative Hyperalgesia Induced by Plantar Incision in Mice

Bing Xu et al. Front Neurosci. .

Abstract

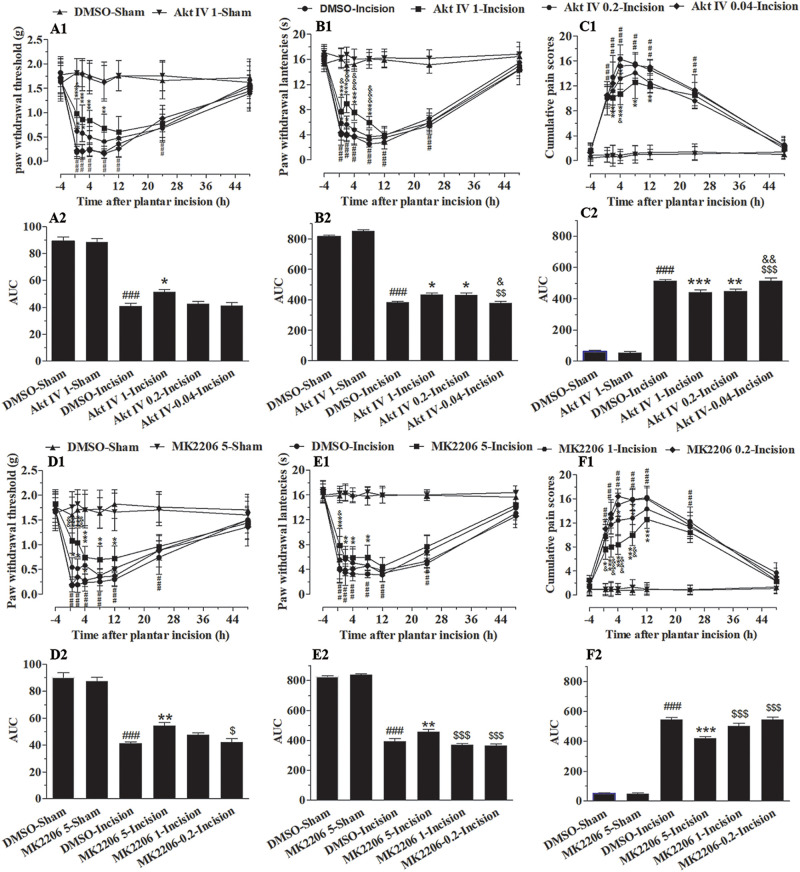
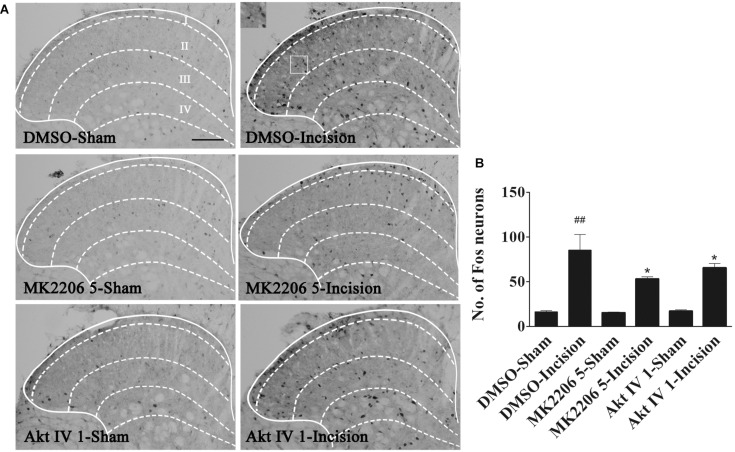
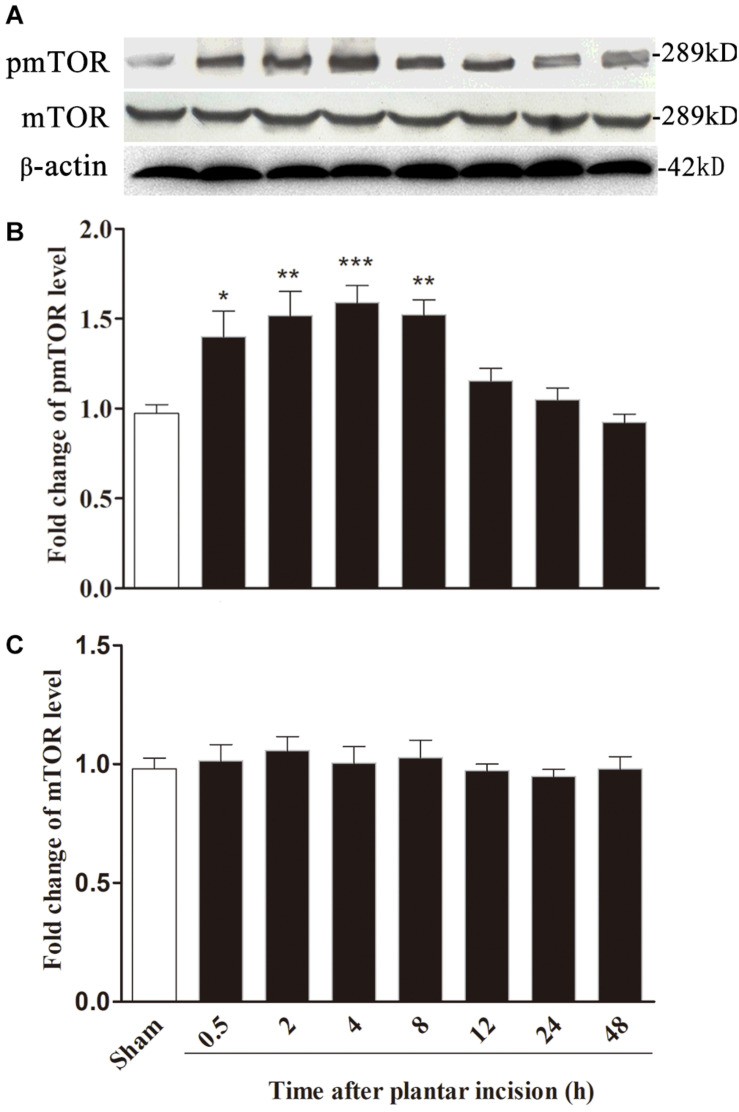
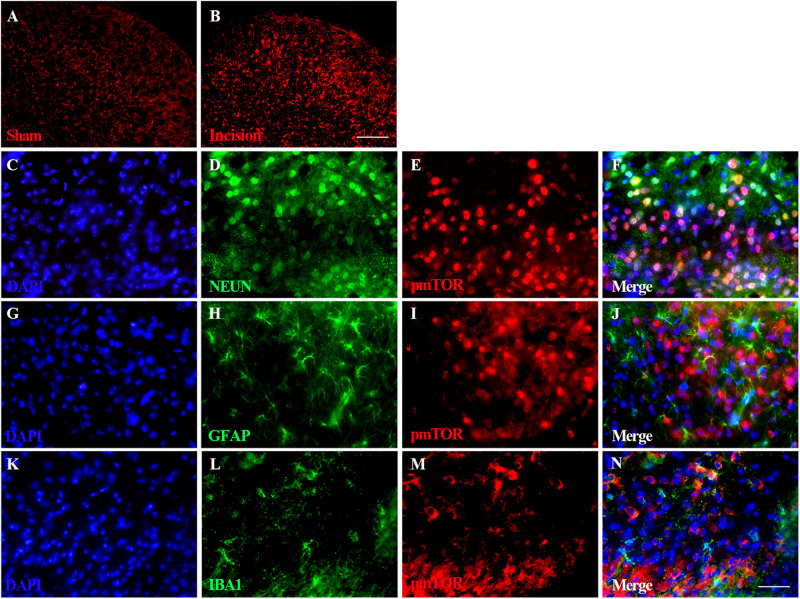
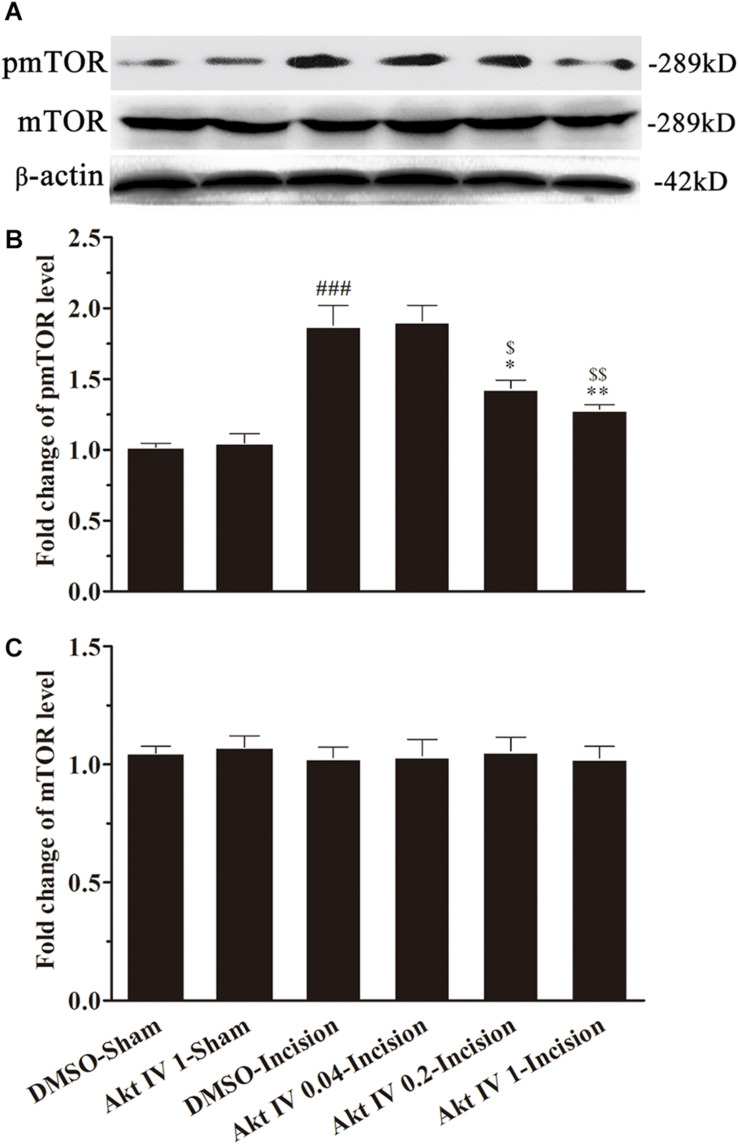
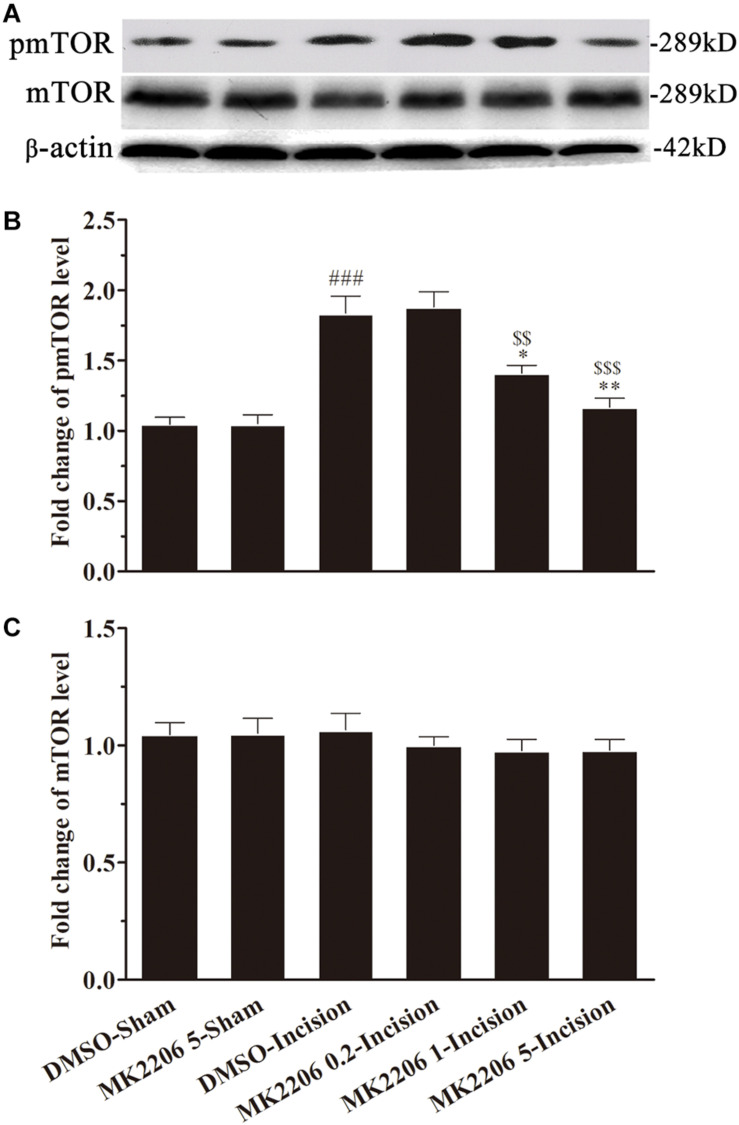
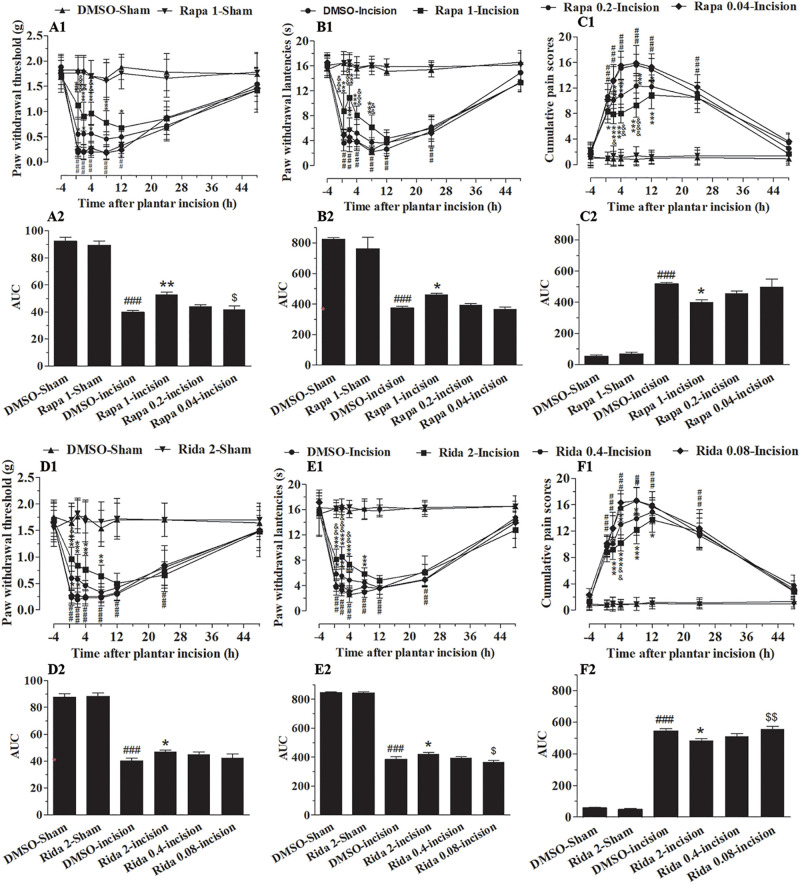
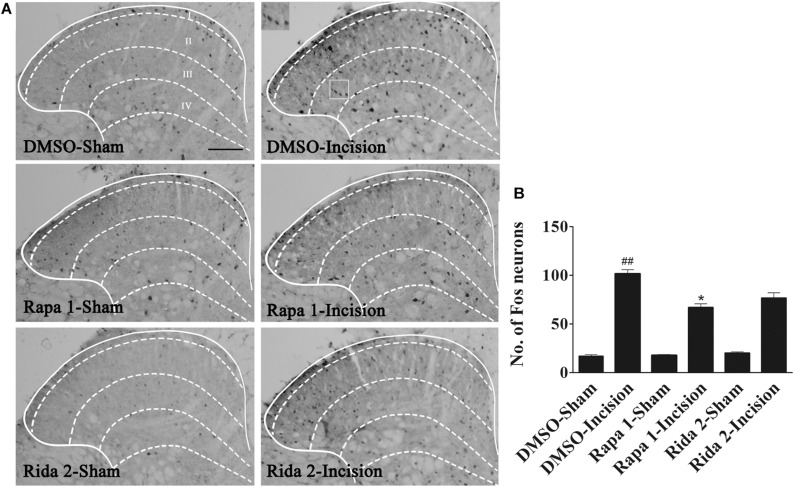
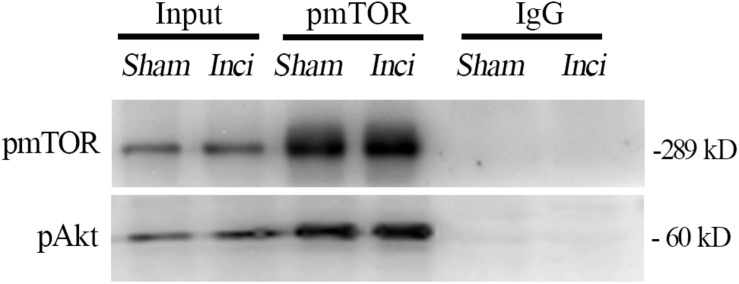
Poor postoperative pain (POP) control increases perioperative morbidity, prolongs hospitalization days, and causes chronic pain. However, the specific mechanism(s) underlying POP is unclear and the identification of optimal perioperative treatment remains elusive. Akt and mammalian target of rapamycin (mTOR) are expressed in the spinal cord, dorsal root ganglion, and sensory axons. In this study, we explored the role of Akt and mTOR in pain-related behaviors induced by plantar incision in mice. Plantar incision activated spinal Akt and mTOR in a dose-dependent manner. Pre-treatment with Akt inhibitors intrathecally prevented the activation of mTOR dose-dependently. In addition, blocking the Akt-mTOR signaling cascade attenuated pain-related behaviors and spinal Fos protein expression induced by plantar incision. Our observations demonstrate that Akt-mTOR might be a potential therapeutic target for the treatment of POP.

Keywords: incisional pain; mice; protein kinase B; spinal dorsal corn; the mammalian target of rapamycin kinase.


Figures

FIGURE 1
FIGURE 1
Blocking of spinal Akt attenuated mechanical allodynia, thermal hyperalgesia, and cumulative pain scores induced by plantar incision. Two selective inhibitors of Akt, Akt IV (0.04, 0.2, and 1 μg in 5% DMSO 5 μl), MK2206 (0.2, 1, and 5 μg in 5% DMSO 5 μl), or vehicle (5% DMSO 5 μl) were intrathecally injected 30 min before plantar incision. PWT to mechanical stimuli, PWL to radiant heat and CPS were recorded at −4, 0.5, 2, 4, 8, 12, 24, and 48 h after plantar incision. Pre-treatment with various doses of Akt IV (A1–C1) or MK2206 (D1–F1) attenuated the decrease of PWT (A1,D1) and PWL (B1,E1), or the increase of CPS (C1,F1) induced by plantar incision. The calculated area under the curve (AUC) was significantly increased in Akt IV 1- or MK2206 5-Incision groups in PWL (B2,E2) and PWT (A2,D2) tests, and was significantly decreased in Akt IV 1-, Akt IV 0. 2-, or MK2206 5-Incision groups in CPS (C2,F2) tests. ###P<0.001, compared with DMSO-Sham group; P< 0.05, ∗∗P < 0.01, ∗∗∗P< 0.001, compared with the DMSO-Incision group;&P<0.05, &⁣&P<0.01, &⁣&⁣&P<0.001, compared with the Akt IV 0.2-Incision group or MK2206 1-Incision group; $P<0.05, $$P<0.01, [dollar][dollar][dollar]P < 0.001. compared with Akt IV 1-Incision group or MK2206 5-Incision group. (A1–F1) Two-way repeated measure ANOVA were applied to all comparisons, followed by Bonferroni’s posttest. “Drug” was treated as a “between” subject factor, “Time” was treated as “within subjects” factor. (A1) Drug: F(5, 432) = 247.96, P< 0.0001; Time: F(7, 432) = 86.53, P< 0.0001; (B1) Drug: F(4, 315) = 726.26, P< 0.0001; Time: F(7, 315) = 430.04, P< 0.0001; (C1) Drug: F(4, 315) = 366.06, P< 0.0001; Time: F(7, 315) = 286.03, P< 0.0001; (D1) Drug: F(7, 315) = 123.9, P< 0.0001; Time: F(4, 315) = 149.59, P< 0.0001. (E1) Drug: F(7, 315) = 266.95, P< 0.0001; Time: F(4, 315) = 468.07, P< 0.0001. (F1) Drug: F(7, 315) = 288.19, P< 0.0001; Time: F(4, 315) = 471.47, P< 0.0001. (A2–F2) One-way ANOVA followed by Bonferroni’s Multiple Comparison Test. n = 10. Data were presented as mean ± SEM.
FIGURE 2
FIGURE 2
Blocking of spinal Akt prevented the up-regulation of spinal Fos protein expression induced by plantar incision. Inhibitors of Akt, Akt IV (1 μg in 5% DMSO 5 μl), MK2206 (5 μg in 5% DMSO 5 μl), or vehicle (5% DMSO 5 μl) were intrathecally injected 30 min before plantar incision. Fos protein expression was assayed at 1 h after plantar incision. (A) Representative immunohistochemical staining of spinal Fos protein expression. (B) Quantitative analysis of spinal Fos protein expression.##P<0.01, compared with DMSO-Sham group; *P<0.05, compared with DMSO-Incision group. One-way ANOVA followed by Bonferroni’s Multiple Comparison Test. n = 6, scale bar = 200 μm.
FIGURE 3
FIGURE 3
Plantar incision induced a time-dependent activation of mTOR in ipsilateral spinal cord. The expression of pmTOR and mTOR was assayed at sham, 0.5, 2, 4, 8, 12, 24, and 48 h after plantar incision. Representative bands (A) of protein expression at different time point after plantar incision and the quantitative data of pmTOR (B) and mTOR (C) expression are shown. *P<0.05, **P<0.01, ***P<0.001, compared with sham group. One-way ANOVA followed by Dunnett’s Multiple Comparison Test. n = 4. Data were presented as mean ± SEM.
FIGURE 4
FIGURE 4
Distribution and cellular localization of spinal activated mTOR. Immunofluorescence staining of spinal pmTOR was performed at 4 h after plantar incision. Triple immunofluorescence staining of pmTOR (red) was performed with cell-specific markers: neuronal nuclei (NeuN, green) for neurons, glial fibrillary acidic protein (GFAP, green) for astrocytes and Ionized calcium binding adapter molecule 1 (IBA1, green) for microglia. The pmTOR was distributed in the spinal dorsal horn (A,B), and was co-localized with neurons (F), and microglia (N), but not with astrocytes. Scale bar-200 μm (A,B); 50 μm (C–N).
FIGURE 5
FIGURE 5
Akt IV inhibited the activation of spinal mTOR induced by plantar incision. Inhibitors of Akt, Akt IV (0.04, 0.2, and 1 μg in 5 μl of 5% DMSO) or vehicle (5 μl of 5% DMSO) were intrathecally injected 30 min before plantar incision. The expression pmTOR and mTOR protein was assayed 4 h after plantar incision by western blot. Pre-treatment with Akt IV dose-dependently prevented the up-regulation of spinal pmTOR induced by plantar incision. The representative bands (A) for the expression of pmTOR and mTOR at different time points after plantar incision and the quantitative data for the expression of pmTOR (B) and mTOR (C) are shown. ###P<0.001, compared with DMSO -Sham group; *P<0.05, **P<0.01, compared with DMSO-Incision group; $P<0.05, $$P<0.01, compared with Akt IV 0.04-Incision group. One-way ANOVA followed by Bonferroni’s Multiple Comparison Test. n = 4. Data were presented as mean ± SEM.
FIGURE 6
FIGURE 6
MK2206 inhibited the activat.ion of spinal mTOR induced by plantar incision. Inhibitors of Akt, MK2206 (0.2, 1, and 5 μg in 5 μl of 5% DMSO) or vehicle (5% DMSO 5 μl) were intrathecally injected 30 min before plantar incision. The expression pmTOR and mTOR protein was assayed 4 h after plantar incision by western blot. Pre-treatment with MK2206 dose-dependently prevented the up-regulation of spinal pmTOR induced by plantar incision. The representative bands (A) for pmTOR and mTOR expression at different time point after plantar incision and the quantitative data for pmTOR (B) and mTOR (C) expression are shown. ###P<0.001, compared with DMSO-Sham group; P<0.05, ∗∗P<0.01, compared with DMSO-Incision group; $$P<0.01, $$$P<0.001, compared with MK2206 0.2-Incision group. One-way ANOVA followed by Bonferroni’s Multiple Comparison Test. n = 4. Data were presented as mean ± SEM.
FIGURE 7
FIGURE 7
Inhibition of spinal mTOR prevented the pain-related behavior induced by plantar incision. Two selective inhibitors of mTOR, Rapa (0.04, 0.2, and 1 μg in 5 μl of 5% DMSO), Rida (0.08, 0.4, and 2 μg in 5% DMSO 5 μl), or vehicle (5% DMSO 5 μl) were administered intrathecally 30 min before plantar incision. Paw withdrawal threshold (PWT) to mechanical stimuli, paw withdrawal latency (PWL) to radiant heat and cumulative pain scores (CPS) were recorded at −4, 0.5, 2, 4, 8, 12, 24, and 48 h after plantar incision. Pre-treatment with various doses of Rapa (A1–C1) or Rida (D1–F1) attenuated the decrease of PWT (A1,D1) and PWL (B1,E1), or the up-increase in CPS (C1,F1) induced by plantar incision. The calculated area under the curve (AUC) in the PWL (B2,E2) and PWT (A2,D2) tests was significantly increased in incised groups given either Rapa (1 μg) or Rida (2 μg) and was significantly decreased in the same groups in CPS (C2,F2).###P<0.001, compared with DMSO -Sham group; *P<0.05, **P<0.01, ***P<0.001, compared with DMSO-Incision group;&P<0.05, &⁣&P<0.01, &⁣&⁣&P<0.001, compared with Rapa 0.2-Incision group or Rida 0.4-Incision group; $P<0.05, $$P< 0.01, compared with Rapa 1-Incision group or Rida 2-Incision group. (A1–F1) Two-way repeated measure ANOVA followed by Bonferroni’s posttest, “Drug” was treated as a “between” subject factor, “Time” was treated as “within subjects” factor. (A1) Drug: F(7, 315) = 115.36, P< 0.0001; Time: F(4, 315) = 419.67, P< 0.0001. (B1) Drug: F(7, 315) = 301.77, P< 0.0001; Time: F(4, 315) = 612.98, P< 0.0001. (C1) Drug: F(7, 315) = 231.87, P< 0.0001; Time: F(4, 315) = 519.38, P< 0.0001. (D1) Drug: F(7, 315) = 120.06, P< 0.0001; Time: F(4, 315) = 198.13, P< 0.0001. (E1) Drug: F(7, 315) = 331.86, P< 0.0001; Time: F(4, 315) = 809.17, P< 0.0001. (F1) Drug: F(7, 315) = 323.01, P< 0.0001; Time: F(4, 315) = 401.37, P< 0.0001. (A2–F2) One-way ANOVA followed by Bonferroni’s Multiple Comparison Test. n = 10. Data were presented as mean ± SEM.
FIGURE 8
FIGURE 8
Blocking of spinal mTOR prevented the up-regulation of spinal Fos protein expression induced by plantar incision. Inhibitors of mTOR, Rapa (1 μg in 5 μl of 5% DMSO), Rida (2 μg in 5 μl of 5% DMSO), or vehicle (5% DMSO 5 μl) were intrathecally injected 30 min before plantar incision. Fos protein expression was assayed 1 h after plantar incision. (A) Representative immunohistochemical staining of spinal Fos protein expression. (B) Quantitative data of spinal Fos protein expression.##P<0.01, compared with DMSO -Sham group; *P< 0.05, compared with DMSO-Incision group. One-way ANOVA followed by Bonferroni’s Multiple Comparison Test. n = 6, scale bar = 200 μm.
FIGURE 9
FIGURE 9
Interactions between pmTOR and pAkt in the spinal cord after plantar incision. The interaction between pmTOR and pAkt in the spinal cord was determined by co-immunoprecipitation analysis. Spinal cord homogenates (4 h after plantar incision or sham operation) were immunoprecipitated with pmTOR antibody, and immunoblotted with pAkt antibody. n = 4.

Similar articles

Cited by

References

    1. Asante C. O., Wallace V., Dickenson A. H. (2009). Formalin-induced behavioural hypersensitivity and neuronal hyperexcitability are mediated by rapid protein synthesis at the spinal level. Mol. Pain 5:27. 10.1186/1744-8069-5-27 - DOI - PMC - PubMed
    1. Brazil D. P., Yang Z., Hemmings B. A. (2004). Advances in protein kinase B signalling: AKTion on multiple fronts. Trends Biochem. Sci. 29 233–242. 10.1016/j.tibs.2004.03.006 - DOI - PubMed
    1. Brennan T. J., Vandermeulen E., Gebhart G. (1996). Characterization of a rat model of incisional pain. Pain 64 493–501. 10.1016/0304-3959(95)01441-1 - DOI - PubMed
    1. Cai L., Liu Q., Guo Q., Huang Q., Zhang R., Cao Z. (2020). MiR-15a attenuates peripheral nerve injury-induced neuropathic pain by targeting AKT3 to regulate autophagy. Genes Genomics 42 77–85. 10.1007/s13258-019-00881-z - DOI - PubMed
    1. Cai W., Zhang Y., Liu H., Liu Z., Zhang H., Su Z. (2019). Effects of miR-150 on neuropathic pain process via targeting AKT3. Biochem. Biophys. Res. Commun. 517 532–537. 10.1016/j.bbrc.2019.07.061 - DOI - PubMed