

Human skeletal muscle metabolic responses to 6 days of high-fat overfeeding are associated with dietary n-3PUFA content and muscle oxidative capacity
- PMID: 32845565
- PMCID: PMC7448800
- DOI: 10.14814/phy2.14529
Human skeletal muscle metabolic responses to 6 days of high-fat overfeeding are associated with dietary n-3PUFA content and muscle oxidative capacity
Abstract
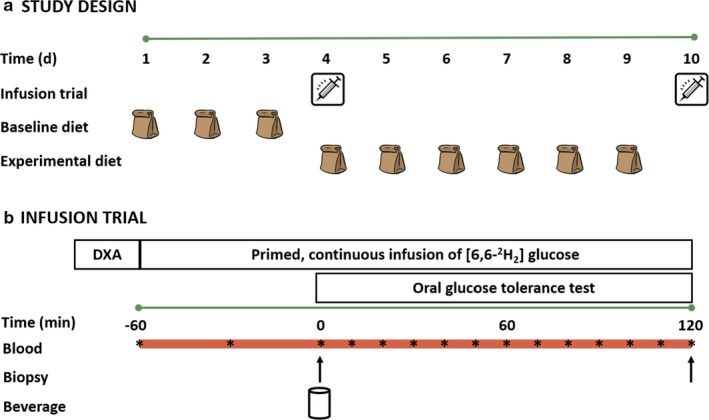
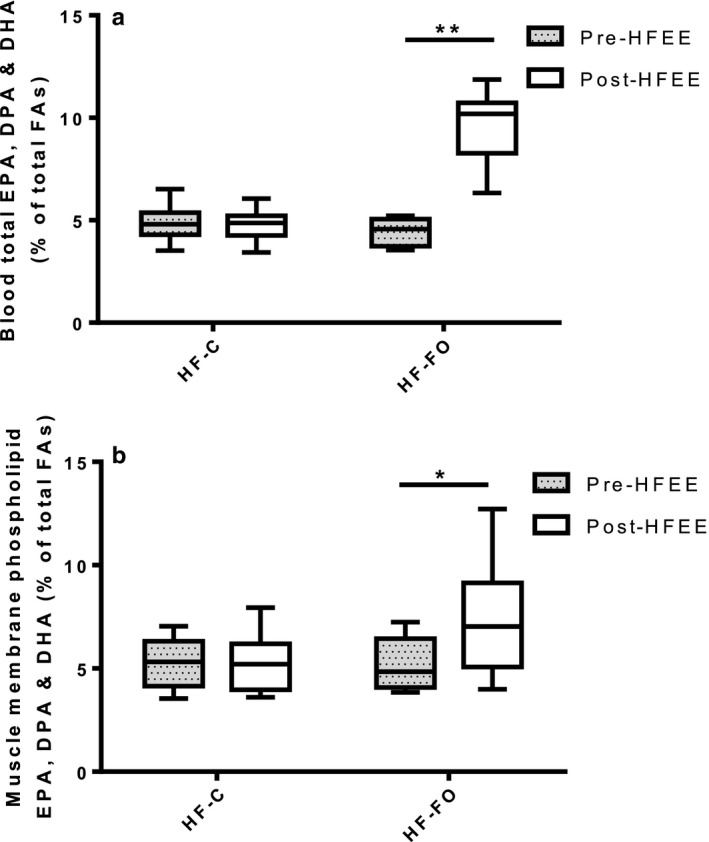
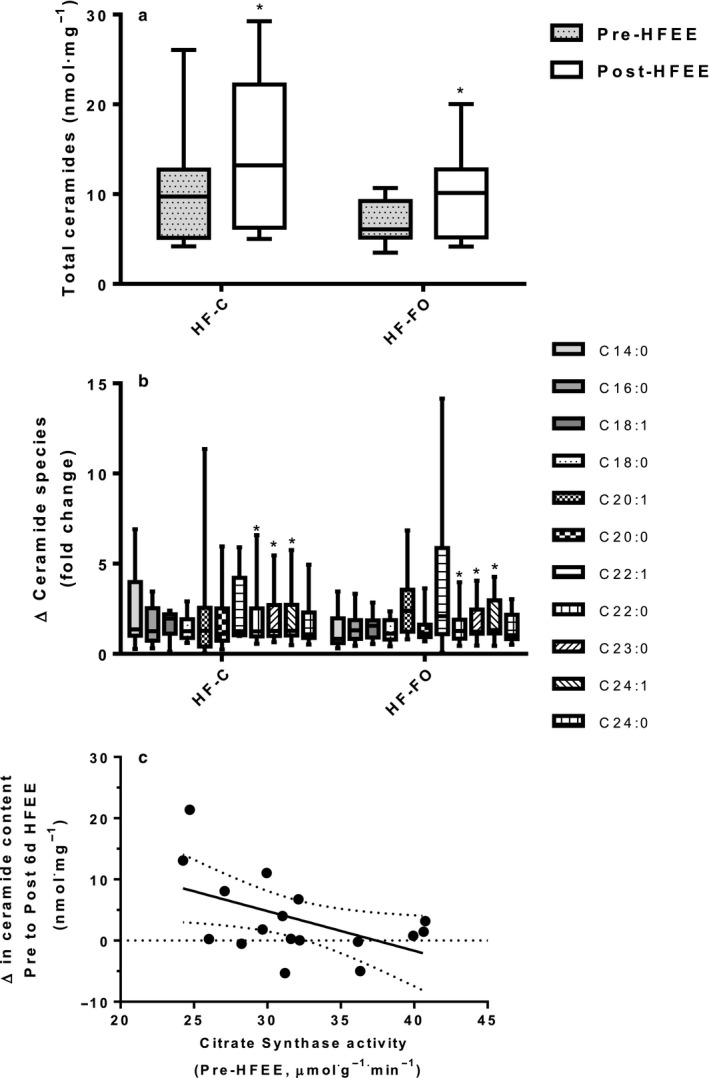
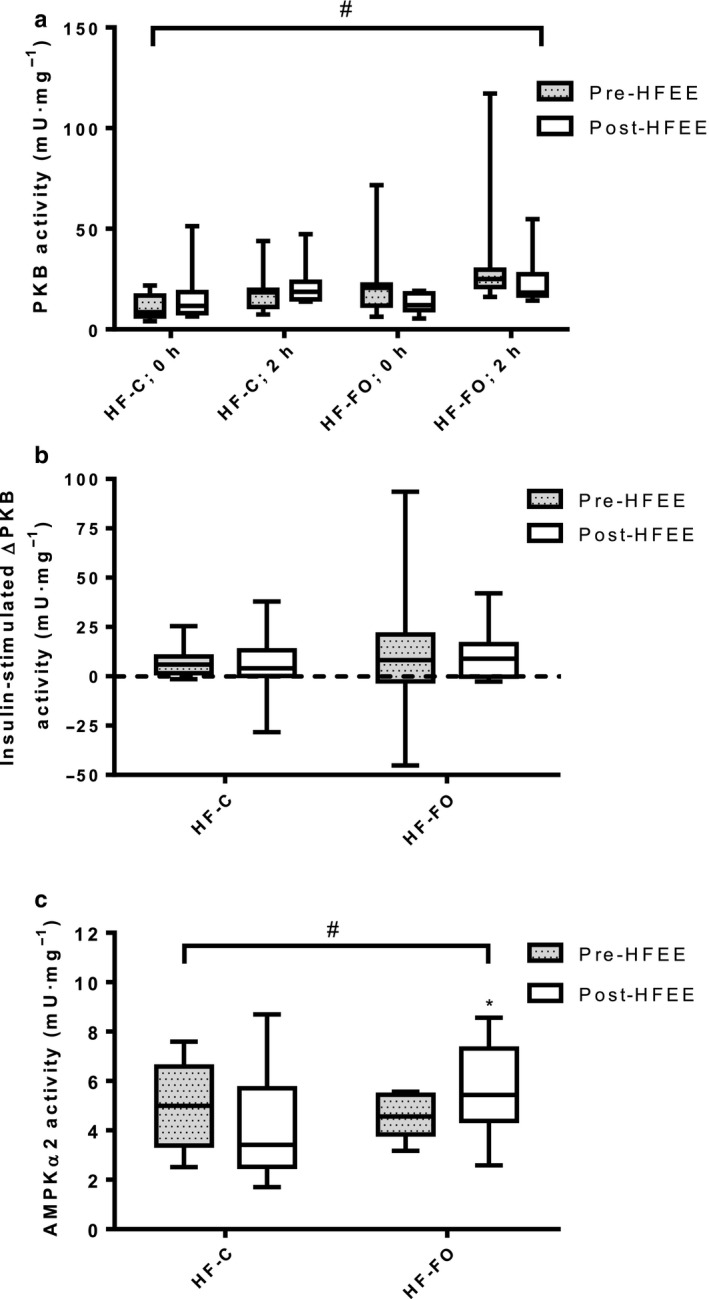
Understanding human physiological responses to high-fat energy excess (HFEE) may help combat the development of metabolic disease. We aimed to investigate the impact of manipulating the n-3PUFA content of HFEE diets on whole-body and skeletal muscle markers of insulin sensitivity. Twenty healthy males were overfed (150% energy, 60% fat, 25% carbohydrate, 15% protein) for 6 d. One group (n = 10) received 10% of fat intake as n-3PUFA rich fish oil (HF-FO), and the other group consumed a mix of fats (HF-C). Oral glucose tolerance tests with stable isotope tracer infusions were conducted before, and following, HFEE, with muscle biopsies obtained in basal and insulin-stimulated states for measurement of membrane phospholipids, ceramides, mitochondrial enzyme activities, and PKB and AMPKα2 activity. Insulin sensitivity and glucose disposal did not change following HFEE, irrespective of group. Skeletal muscle ceramide content increased following HFEE (8.5 ± 1.2 to 12.1 ± 1.7 nmol/mg, p = .03), irrespective of group. No change in mitochondrial enzyme activity was observed following HFEE, but citrate synthase activity was inversely associated with the increase in the ceramide content (r=-0.52, p = .048). A time by group interaction was observed for PKB activity (p = .003), with increased activity following HFEE in HF-C (4.5 ± 13.0mU/mg) and decreased activity in HF-FO (-10.1 ± 20.7 mU/mg) following HFEE. Basal AMPKα2 activity increased in HF-FO (4.1 ± 0.6 to 5.3 ± 0.7mU/mg, p = .049), but did not change in HF-C (4.6 ± 0.7 to 3.8 ± 0.9mU/mg) following HFEE. We conclude that early skeletal muscle signaling responses to HFEE appear to be modified by dietary n-3PUFA content, but the potential impact on future development of metabolic disease needs exploring.
Keywords: exercise; fish oil; insulin resistance; omega-3; overfeeding; type 2 diabetes.
© 2020 The Authors. Physiological Reports published by Wiley Periodicals, Inc. on behalf of The Physiological Society and the American Physiological Society.
Conflict of interest statement
The authors have no conflicts of interest. The Diabetes Research and Wellness Foundation supported the study with a grant to KDT, CM and SDRG. Fish oils were provided for the study by SMARTFISH Nutrition, Norway. SLW was supported by a University of Stirling funded PhD studentship.
Figures

Similar articles
-
Long-chain omega-3 fatty acids regulate bovine whole-body protein metabolism by promoting muscle insulin signalling to the Akt-mTOR-S6K1 pathway and insulin sensitivity.J Physiol. 2007 Feb 15;579(Pt 1):269-84. doi: 10.1113/jphysiol.2006.121079. Epub 2006 Dec 7. J Physiol. 2007. PMID: 17158167 Free PMC article.
-
Dietary enrichment with fish oil prevents high fat-induced metabolic dysfunction in skeletal muscle in mice.PLoS One. 2015 Feb 6;10(2):e0117494. doi: 10.1371/journal.pone.0117494. eCollection 2015. PLoS One. 2015. PMID: 25658742 Free PMC article.
-
Adiponectin resistance precedes the accumulation of skeletal muscle lipids and insulin resistance in high-fat-fed rats.Am J Physiol Regul Integr Comp Physiol. 2009 Feb;296(2):R243-51. doi: 10.1152/ajpregu.90774.2008. Epub 2008 Dec 10. Am J Physiol Regul Integr Comp Physiol. 2009. PMID: 19073900
-
Attenuation of obesity and insulin resistance by fish oil supplementation is associated with improved skeletal muscle mitochondrial function in mice fed a high-fat diet.J Nutr Biochem. 2018 May;55:76-88. doi: 10.1016/j.jnutbio.2017.11.012. Epub 2017 Dec 11. J Nutr Biochem. 2018. PMID: 29413492
-
Sphingolipids as a Culprit of Mitochondrial Dysfunction in Insulin Resistance and Type 2 Diabetes.Front Endocrinol (Lausanne). 2021 Mar 18;12:635175. doi: 10.3389/fendo.2021.635175. eCollection 2021. Front Endocrinol (Lausanne). 2021. PMID: 33815291 Free PMC article. Review.
Cited by
-
Ceramides as Emerging Players in Cardiovascular Disease: Focus on Their Pathogenetic Effects and Regulation by Diet.Adv Nutr. 2024 Jul;15(7):100252. doi: 10.1016/j.advnut.2024.100252. Epub 2024 Jun 12. Adv Nutr. 2024. PMID: 38876397 Free PMC article. Review.
-
Is vascular insulin resistance an early step in diet-induced whole-body insulin resistance?Nutr Diabetes. 2022 Jun 8;12(1):31. doi: 10.1038/s41387-022-00209-z. Nutr Diabetes. 2022. PMID: 35676248 Free PMC article. Review.
-
In Vivo and In Vitro Quantification of Glucose Kinetics: From Bedside to Bench.Endocrinol Metab (Seoul). 2020 Dec;35(4):733-749. doi: 10.3803/EnM.2020.406. Epub 2020 Dec 23. Endocrinol Metab (Seoul). 2020. PMID: 33397035 Free PMC article. Review.
-
Fish Oil Supplement Mitigates Muscle Injury In Vivo and In Vitro: A Preliminary Report.Nutrients. 2024 Oct 16;16(20):3511. doi: 10.3390/nu16203511. Nutrients. 2024. PMID: 39458505 Free PMC article.
-
The effect of fish oil supplementation on resistance training-induced adaptations.J Int Soc Sports Nutr. 2023 Dec;20(1):2174704. doi: 10.1080/15502783.2023.2174704. J Int Soc Sports Nutr. 2023. PMID: 36822153 Free PMC article. Clinical Trial.
References
-
- Ackman, R. G. , Eaton, C. A. , & Dyerberg, J. (1980). Marine docosenoic acid isomer distribution in the plasma of Greenland Eskimos. American Journal of Clinical Nutrition, 33, l814–l817. - PubMed
-
- Albert, B. B. , Derraik, J. G. B. , Brennan, C. M. , Biggs, J. B. , Smith, G. C. , Garg, M. L. , … Cutfield, W. S. (2014). Higher omega‐3 index is associated with increased insulin sensitivity and more favourable metabolic profile in middle‐aged overweight men. Scientific Reports, 4(1); 10.1038/srep06697. - DOI - PMC - PubMed
Publication types
MeSH terms
Substances
LinkOut - more resources
Full Text Sources
Research Materials
Miscellaneous
