A face-to-face comparison of claudin-5 transduced human brain endothelial (hCMEC/D3) cells with porcine brain endothelial cells as blood-brain barrier models for drug transport studies
- PMID: 32843059
- PMCID: PMC7449095
- DOI: 10.1186/s12987-020-00212-5
A face-to-face comparison of claudin-5 transduced human brain endothelial (hCMEC/D3) cells with porcine brain endothelial cells as blood-brain barrier models for drug transport studies
Abstract
Background: Predictive in vitro models of the human blood-brain barrier (BBB) are essential in early drug discovery and development. Among available immortalized human brain capillary endothelial cell lines (BCECs), the hCMEC/D3 cell line has become the most widely used in vitro BBB model. However, monolayers of hCMEC/D3 cells form only moderately restrictive barriers, most likely because the major tight junction protein, claudin-5, is markedly downregulated. Thus, hCMEC/D3 monolayers cannot be used for vectorial drug transport experiments, which is a major disadvantage of this model.
Methods: Here we transduced hCMEC/D3 cells with a claudin-5 plasmid and compared the characteristics of these cells with those of hCMEC/D3 wildtype cells and primary cultured porcine BCECs.
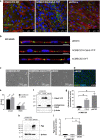
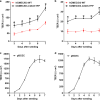
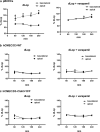
Results: The claudin-5 transduced hCMEC/D3 exhibited expression levels (and junctional localization) of claudin-5 similar to those of primary cultured porcine BCECs. The transduced cells exhibited increased TEER values (211 Ω cm2) and reduced paracellular mannitol permeability (8.06%/h), indicating improved BBB properties; however, the barrier properties of porcine BCECs (TEER 1650 Ω cm2; mannitol permeability 3.95%/h) were not reached. Hence, vectorial transport of a selective P-glycoprotein substrate (N-desmethyl-loperamide) was not observed in claudin-5 transduced hCMEC/D3 (or wildtype) cells, whereas such drug transport occurred in porcine BCECs.
Conclusions: The claudin-5 transduced hCMEC/D3 cells provide a tool to studying the contribution of claudin-5 to barrier tightness and how this can be further enhanced by additional transfections or other manipulations of this widely used in vitro model of the BBB.
Keywords: P-glycoprotein; Porcine brain endothelial cells; Primary culture; Transwell.
Conflict of interest statement
The authors declare that they have no competing interests.
Figures


Similar articles
-
Similarities and differences in the localization, trafficking, and function of P-glycoprotein in MDR1-EGFP-transduced rat versus human brain capillary endothelial cell lines.Fluids Barriers CNS. 2021 Aug 3;18(1):36. doi: 10.1186/s12987-021-00266-z. Fluids Barriers CNS. 2021. PMID: 34344390 Free PMC article.
-
Comparative study of four immortalized human brain capillary endothelial cell lines, hCMEC/D3, hBMEC, TY10, and BB19, and optimization of culture conditions, for an in vitro blood-brain barrier model for drug permeability studies.Fluids Barriers CNS. 2013 Nov 22;10(1):33. doi: 10.1186/2045-8118-10-33. Fluids Barriers CNS. 2013. PMID: 24262108 Free PMC article.
-
Studies of blood-brain barrier permeability of gastrodigenin in vitro and in vivo.Fitoterapia. 2020 Jan;140:104447. doi: 10.1016/j.fitote.2019.104447. Epub 2019 Dec 2. Fitoterapia. 2020. PMID: 31805306
-
A review on in vitro model of the blood-brain barrier (BBB) based on hCMEC/D3 cells.J Control Release. 2023 Jun;358:78-97. doi: 10.1016/j.jconrel.2023.04.020. Epub 2023 Apr 29. J Control Release. 2023. PMID: 37076016 Review.
-
Rat brain endothelial cell lines for the study of blood-brain barrier permeability and transport functions.Cell Mol Neurobiol. 2005 Feb;25(1):41-58. doi: 10.1007/s10571-004-1376-9. Cell Mol Neurobiol. 2005. PMID: 15962508 Review.
Cited by
-
Development of Real-Time Transendothelial Electrical Resistance Monitoring for an In Vitro Blood-Brain Barrier System.Micromachines (Basel). 2020 Dec 30;12(1):37. doi: 10.3390/mi12010037. Micromachines (Basel). 2020. PMID: 33396953 Free PMC article.
-
Development of a multicellular in vitro model of the meningeal blood-CSF barrier to study Neisseria meningitidis infection.Fluids Barriers CNS. 2022 Oct 26;19(1):81. doi: 10.1186/s12987-022-00379-z. Fluids Barriers CNS. 2022. PMID: 36289516 Free PMC article.
-
Modeling the blood-brain barrier for treatment of central nervous system (CNS) diseases.J Tissue Eng. 2022 May 14;13:20417314221095997. doi: 10.1177/20417314221095997. eCollection 2022 Jan-Dec. J Tissue Eng. 2022. PMID: 35586265 Free PMC article. Review.
-
A human-derived neurovascular unit in vitro model to study the effects of cellular cross-talk and soluble factors on barrier integrity.Front Cell Neurosci. 2022 Dec 1;16:1065193. doi: 10.3389/fncel.2022.1065193. eCollection 2022. Front Cell Neurosci. 2022. PMID: 36545654 Free PMC article.
-
Tight Junction Modulating Bioprobes for Drug Delivery System to the Brain: A Review.Pharmaceutics. 2020 Dec 19;12(12):1236. doi: 10.3390/pharmaceutics12121236. Pharmaceutics. 2020. PMID: 33352631 Free PMC article. Review.
References
-
- Abbott NJ, Patabendige AA, Dolman DE, Yusof SR, Begley DJ. Structure and function of the blood–brain barrier. Neurobiol Dis. 2010;37:13–25. - PubMed
-
- Abbott NJ. Blood-brain barrier structure and function and the challenges for CNS drug delivery. J Inherit Metab Dis. 2013;36:437–449. - PubMed
-
- Löscher W, Potschka H. Drug resistance in brain diseases and the role of drug efflux transporters. Nature Rev Neurosci. 2005;6:591–602. - PubMed
MeSH terms
Substances
Grants and funding
LinkOut - more resources
Full Text Sources

