. 2020 Sep 17;5(18):e138772.
doi: 10.1172/jci.insight.138772.

IL-32γ potentiates tumor immunity in melanoma

Affiliations

IL-32γ potentiates tumor immunity in melanoma

Thomas Gruber et al. JCI Insight. .

Abstract

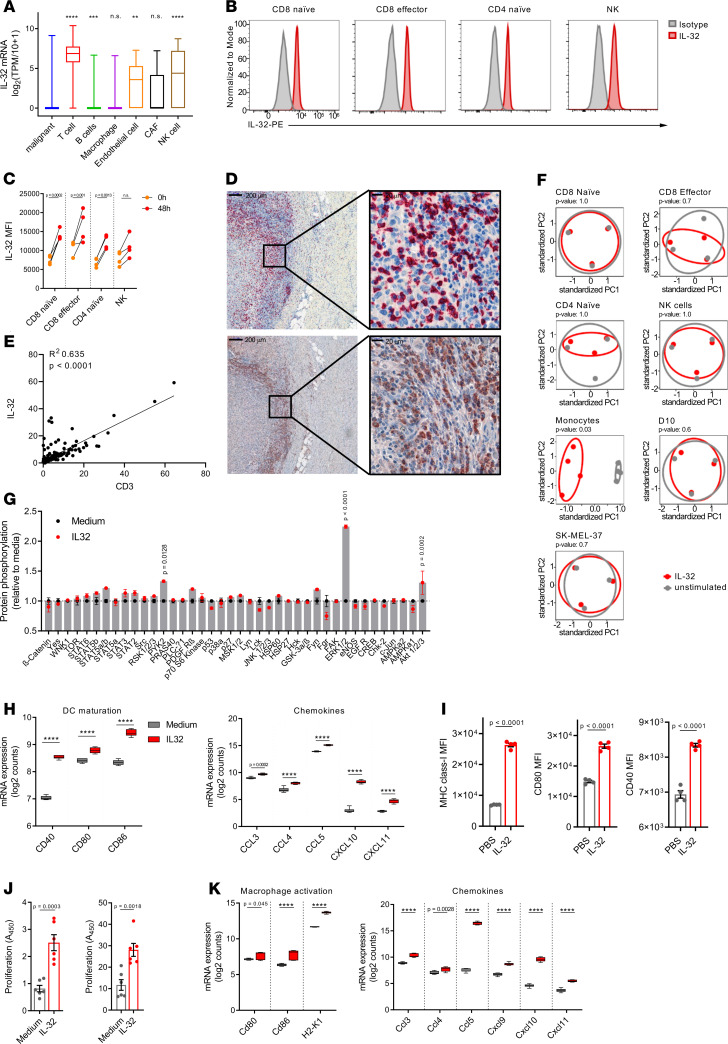
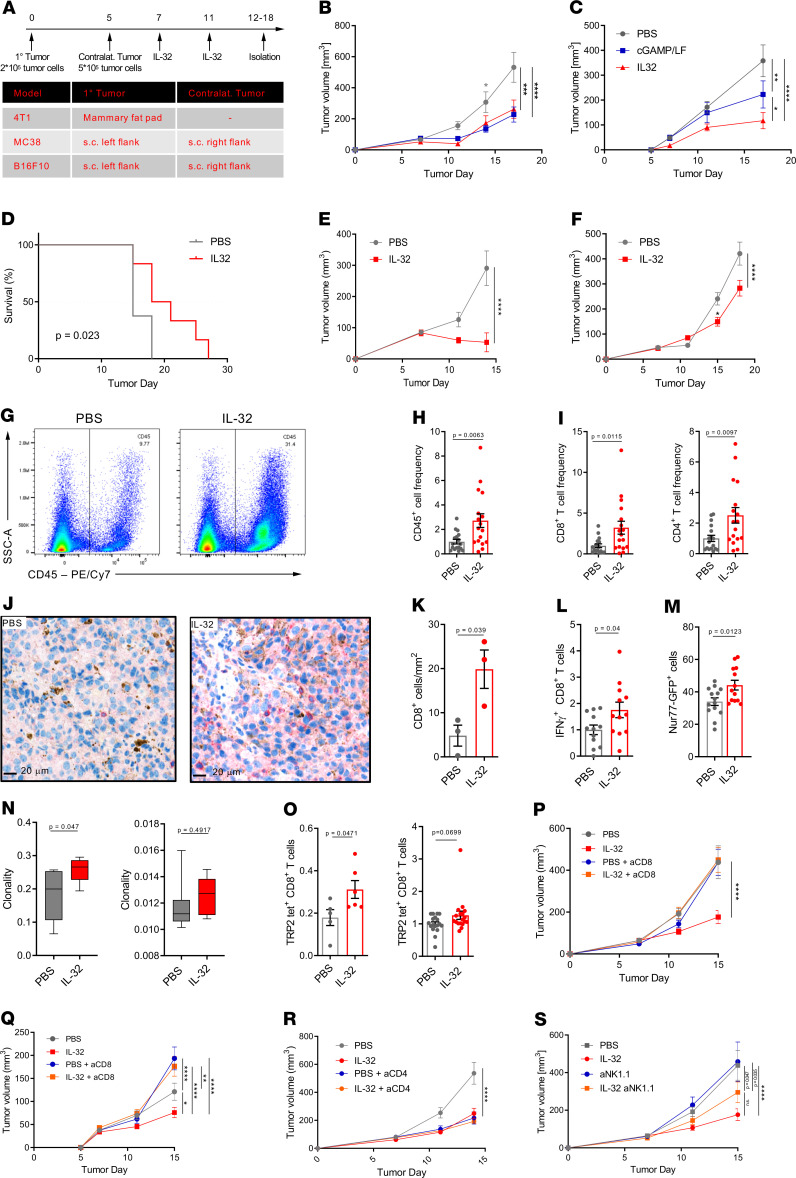
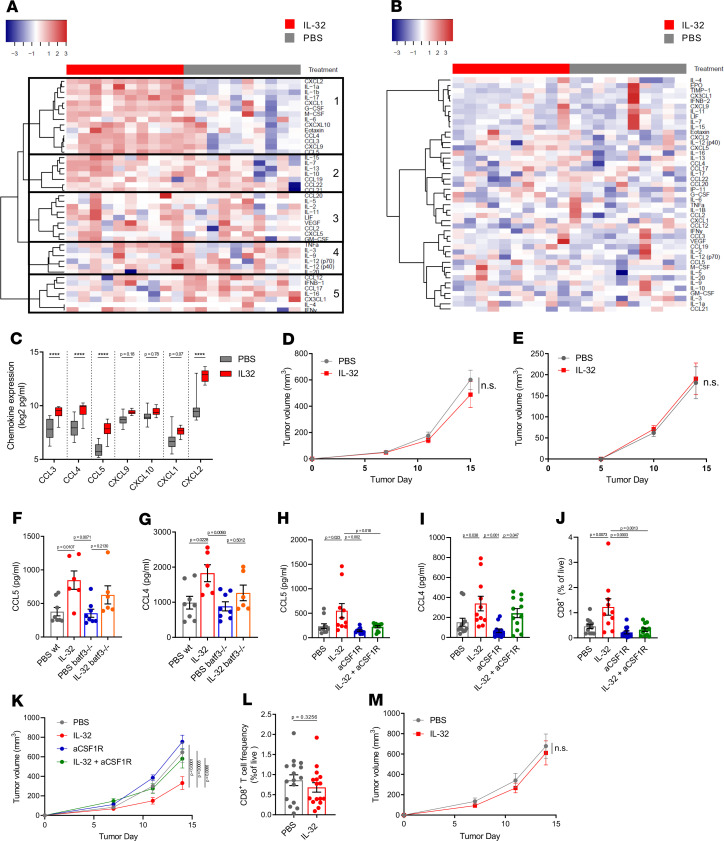
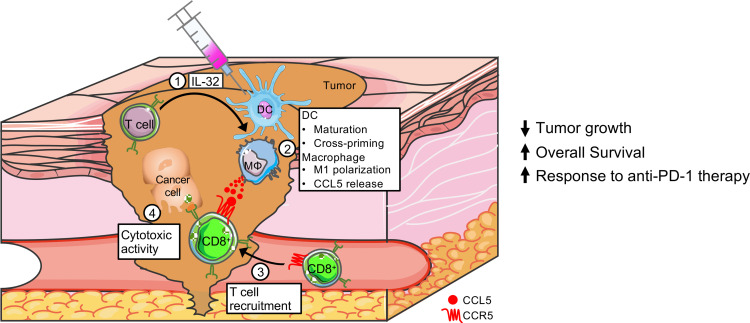
Myeloid cells orchestrate the antitumor immune response and influence the efficacy of immune checkpoint blockade (ICB) therapies. We and others have previously shown that IL-32 mediates DC differentiation and macrophage activation. Here, we demonstrate that IL-32 expression in human melanoma positively correlates with overall survival, response to ICB, and an immune-inflamed tumor microenvironment (TME) enriched in mature DC, M1 macrophages, and CD8+ T cells. Treatment of B16F10 murine melanomas with IL-32 increased the frequencies of activated, tumor-specific CD8+ T cells, leading to the induction of systemic tumor immunity. Our mechanistic in vivo studies revealed a potentially novel role of IL-32 in activating intratumoral DC and macrophages to act in concert to prime CD8+ T cells and recruit them into the TME through CCL5. Thereby, IL-32 treatment reduced tumor growth and rendered ICB-resistant B16F10 tumors responsive to anti-PD-1 therapy without toxicity. Furthermore, increased baseline IL-32 gene expression was associated with response to nivolumab and pembrolizumab in 2 independent cohorts of patients with melanoma, implying that IL-32 is a predictive biomarker for anti-PD-1 therapy. Collectively, this study suggests IL-32 as a potent adjuvant in immunotherapy to enhance the efficacy of ICB in patients with non-T cell-inflamed TME.

Keywords: Cancer immunotherapy; Cellular immune response; Immunology; Melanoma; Oncology.


Conflict of interest statement

Conflict of interest: The authors have declared that no conflict of interest exists.

Figures

Figure 1
Figure 1. IL-32 expression is associated with activation of myeloid cells and increased overall survival in melanoma.
(A) Pearson correlation of IL32 mRNA expression to that of CD11c (ITGAX), CD86, CD80, and CD40 in melanoma samples from TCGA. (B) Pearson correlation of IL32 gene expression to the mature DC score for all available TCGA cohorts. (C) Heatmap of 56 genes defining the mature DC signature, and (D) mature DC score in IL-32lo– and IL-32hi–expressing melanomas (bottom and top 25%, n = 118). Differences between groups were analyzed by unpaired, 2-tailed Student’s t test. The box extends between 25% and 75%, and the whisker extends up to 75% plus IQR and down to 25% minus IQR. (E) Pearson correlation between IL32 mRNA expression and gene signature score specific for cDC1. (F) Kaplan-Meier survival curves for IL-32lo (median survival, 701 days) and IL-32hi (mean survival, not applicable) patients. (A and F) n = 471 biologically independent melanoma samples from TCGA SKCM cohort. (A, D, and E) Each dot represents an individual patient.
Figure 2
Figure 2. IL-32 expression correlates with a T cell–inflamed tumor microenvironment.
(A and B) Gene ontology term enrichment analysis of genes upregulated in IL-32hi melanomas; shown are the top 20 (A) “biological processes” and (B) “molecular functions.” Significantly upregulated genes were identified using FDR cutoff of Bonferroni-Hochberg–adjusted P = 0.01 and a log2 fold change = 1. (C) Gene expression of indicated markers for CD8+ effector T cells, CD8+ T cell–recruiting chemokines and Th1 cytokines in IL-32lo and IL-32hi melanoma samples. Gene expression is shown as normalized, log2-transformed counts. (D) Proportions of immune cells and nonimmune cells (other) in IL-32lo versus IL-32hi tumors, as estimated by quanTiSeq. (E) Relative proportions of indicated immune cell subsets in IL-32lo (n = 14) and IL-32hi (n = 101) groups, as estimated by CIBERSORT. (CE) Data are shown as box-and-whisker plots. The box extends between 25% and 75%, and the whisker extends to the minimum and maximum values. Statistical significance was determined by 2-way ANOVA followed by Šidák’s multiple comparisons test. (AD) n = 118; ****P < 0.0001.
Figure 3
Figure 3. Lymphocyte-derived IL-32 mediates activation of myeloid but not lymphoid or melanoma cells.
(A) IL-32 expression of indicated cell types determined by single-cell RNA-Seq data obtained from GSE72056. Data are shown as box-and-whisker plots. The box extends between 25% and 75%, and the whiskers extend to the minimum and maximum. Statistical significance was determined using 1-way ANOVA followed by Tukey’s multiple comparisons test. (B) Representative histograms of IL-32 expression in indicated immune cell populations from healthy human blood assessed by flow cytometry (n = 4). (C) IL-32 mean fluorescence intensity (MFI) in each immune cell subset treated for 48 hours with anti-CD3/CD28 and IL-2 or left untreated, (n = 4). (D) Representative immunohistochemical labeling for CD8+ T cells (top) and IL-32 (bottom) in serial sections (n = 3). Original magnification, ×5; ×40 (high-magnification images). Scale bars: 200 μm; 20 μm (high-magnification images). (E) Correlation between IL-32+ and CD3+ cells, as assessed by immunofluorescence labeling of a melanoma TMA, indicated as a percentage of DAPI+ cells (n = 154; from 140 individual patients) (F) PCA from NanoString-derived gene expression profiles of purified human PBMC subsets and melanoma cell lines treated with IL-32 for 24 hours or left untreated (monocytes, n = 4; other PBMC subsets, melanoma cell lines, n = 3). Statistical significance was determined using Adonis in the vegan package in R. (G) Kinase phosphorylation levels measured by phospho-kinase array in monocytes treated with IL-32 for 20 minutes or left untreated. Two biologically independent samples were measured in duplicates. (H) RNA expression levels of the indicated DC maturation markers and chemokines in IL-32–treated (24 hours) and untreated murine BMDC (n = 6). (I) MFI of the indicated DC maturation markers assessed by flow cytometry on IL-32–treated versus untreated murine BMDC (n = 4), assessed after 48 hours. (J) Proliferation of OT-I cells cocultured with IL-32–treated or untreated BMDC after 48 hours measured using a BrdU cell proliferation assay kit (BioVision). BMDC were either pulsed with OVA protein (left) or SIINFEKL peptide (right) (n = 6). (I and J) Data shown as mean ± SEM; unpaired, 2-tailed Student’s t test. (K) Gene expression levels of the indicated macrophage activation markers and T cell–attracting chemokines in murine BMDM treated for 24 hours with IL-32 or left untreated, measured by NanoString (n = 6). (H and K) Normalized, log2-transformed mRNA counts shown as box-and-whisker plots. The box extends between 25% and 75%, and the whiskers extend to the minimum and maximum. (C, G, H, and K) Statistical significance was determined using 2-way ANOVA followed by Šidák’s multiple comparisons test. **P < 0.01, ***P < 0.001, ****P < 0.0001.
Figure 4
Figure 4. IL-32 induces a systemic CD8+ T cell–mediated tumor-specific immune response.
(A) Experimental setup for in vivo tumor treatments. MC38 and B16F10 were inoculated in C57BL/6J mice, and 4T1 tumors in BALB/c mice (AO). (B) Growth curves of IL-32–, cGAMP-, or PBS-treated primary and (C) contralateral, nontreated B16F10 melanomas. *P < 0.05, **P < 0.01, ***P < 0.001. Data are representative of 4 independent experiments, with n = 6 mice per group. (D) Kaplan-Meier survival curves of B16F10-bearing mice treated with IL-32 (n = 6) or PBS (n = 8). (E) Representative growth curves of IL-32–treated and untreated MC38 colon adenocarcinoma (n = 6) and (F) orthotopic 4T1 breast tumors (n = 10). (G–O) On day 14, the primary treated tumors and spleens were harvested for flow cytometric analyses, IHC or TCRβ chain sequencing. (G) Representative flow cytometry plots displaying frequencies of CD45+ immune cells for each treatment group and (H) their quantification shown as relative frequencies (n = 18). (I) Relative frequencies of CD8+ and CD4+ T cells as a percentage of live cells (n = 18). (J) Representative immunohistochemical staining and (K) morphometric enumeration as cells/mm2 of CD8+ T cells (n = 3). Scale bar: 20 μm. (L) Relative frequencies of IFN-γ+ cells as percentage of CD8+ T cells (n = 12). (M) Frequencies of Nur77-GFP+ cells of CD8+ T cells, as determined by flow cytometry in B16F10-inoculated and PBS- (n = 14) and IL-32–treat (n = 13) Nur77 mice. (N) TCR clonality in tumors (left, PBS, n = 7; IL-32, n = 5) and spleens (right, PBS, n = 7; IL-32, n = 6), representative of 2 independent experiments. (O) Relative frequencies of TRP-2 tetramer–positive cells, as a proportion of CD8+ T cells in tumors (left, n = 6) and spleens (right, n = 18). (P) Growth curves of IL-32–treated and untreated B16F10 primary tumors (PBS, IL-32, PBS + aCD8, n = 18; IL-32 + aCD8, n = 16) and (Q) untreated contralateral tumors with or without CD8 depletion (n = 16–18). *P = 0.0171; **P = 0.003; ****P < 0.0001. (R) Growth curves of IL-32–treated and untreated B16F10 primary tumors with or without CD4 depletion (n = 11) or (S) NK depletion (PBS, n = 12; IL-32, n = 18). (B, C, E, F, and PS) Growth curves are shown as mean ± SEM, using 2-way ANOVA followed by Šidák’s multiple comparisons test. (D) Comparison of survival curves was performed using a log-rank (Mantel-Cox) test. (H, I, KM, and O) Data are displayed as mean ± SEM. Statistical significance was determined by unpaired, 2-tailed Student’s t test. ****P < 0.0001.
Figure 5
Figure 5. IL-32 treatment efficacy relies on the generation a proinflammatory, chemokine-rich TME.
(AI) Mice bearing B16F10 tumors were treated with IL-32 or PBS as in Figure 4A. (AC) At day 12, tumors and spleens were isolated and lysed. Cytokine and chemokine levels were assessed using multiplexed bead array (n = 10, from 2 independent experiments). Data are represented as log2(pg/mL). (A) Hierarchical clustering of cytokine protein levels in tumor lysates and (B) sera. (C) Protein expression levels of the indicated cytokines and chemokines from tumor lysates, shown as box-and-whisker plot; the box extends between 25% and 75%, and the whiskers extend to the minimum and maximum values. (D) Growth curves of IL-32– or PBS-treated primary (P = 0.2824) and (E) contralateral (P = 0.9859) B16F10 tumors inoculated in Batf3–/– mice. (F) CCL5 and (G) CCL4 expression levels in B16F10 tumors at day 12 after tumor inoculation in B6 WT and Batf3–/– mice, as determined by ELISA (PBS, n = 8; IL-32, n = 6). (H–K) IL-32– or PBS-treated B16F10 tumors in mice with or without macrophage depletion using anti-CSF1R mAb. (H) CCL5 (PBS, aCSF1R, IL-32 + aCSF1R, n = 11; IL-32, n = 10) and (I) CCL4 (PBS, aCSF1R, IL-32 + aCSF1R, n = 12; IL-32, n = 11) expression levels in B16F10 tumors at day 14 after tumor inoculation determined by ELISA. (J) Corresponding CD8+ T cell infiltration, as determined by flow cytometry (PBS, aCSF1R, IL-32 + aCSF1R, n = 12; IL-32, n = 10) and (K) tumor growth curves (PBS, aCSF1R, IL-32 + aCSF1R, n = 6; IL-32, n = 5). (L and M) CCR5–/– mice (n = 16) were inoculated with B16F10 cells. (L) At day 14, tumors were isolated and CD8+ T cell frequencies were determined by FACS. Statistical analysis was performed using 2-tailed Student’s t test. (M) Growth curves of IL-32– or PBS-treated B16F10 tumors in CCR5–/– mice (P = 0.9325). (D, E, K, and M) Tumor growth curves are depicted as mean ± SEM. Differences between groups were determined using 2-way ANOVA followed by Šidák’s multiple comparisons test. ****P < 0.0001.
Figure 6
Figure 6. IL-32 treatment is synergistic with concurrent anti-PD1 in mice, and IL-32 expression is predictive for response to anti-PD1 therapy in patients with melanoma.
(A) Experimental setup for B16F10 dual treatment with IL-32 and anti–PD-1 antibody used in B–D. (B) Tumor growth shown as mean ± SEM (IL-32, aPD1, IL-32 + aPD1, n = 23; PBS, n = 24). Statistical significance was determined by 2-way ANOVA followed by Šidák’s multiple comparisons test. *P = 0.0199, ****P < 0.0001. (C) Frequencies of CD45+ immune cells and (D) CD4+ T cells and CD8+ T cells as a proportion of viable cells (n = 21–23). P values were computed by 1-way ANOVA followed by Tukey’s multiple comparisons test. Data are represented as mean ± SEM. (E) Experimental setup for survival and safety assessment with additional IL-32 and anti–PD-1 treatments used for FJ. (F) Kaplan-Meier survival curves. Significance was determined by log-rank test (IL-32, IL-32 + aPD-1, n = 15; PBS, n = 17). (G) Body temperature and (H) body weight of mice upon treatment (n = 6). (I) White blood cell (WBC), lymphocyte, and red blood cell (RBC) counts as cells/μl blood (n ≥ 4). Blood was obtained when mice were euthanized. Differences between groups were determined using 2-way ANOVA followed by Šidák’s multiple comparisons test. (J) IL32 mRNA expression levels in biopsies from patients with melanoma before anti–PD-1 (nivolumab) treatment. (K) IL32 mRNA expression in biopsies of patients with melanoma receiving neoadjuvant pembrolizumab treatment (nonrecurrence, n = 8; recurrence, n = 5). The data set was obtained from GSE123728. (J and K) P values were computed by 2-tailed, unpaired Student’s t test. Error bars show mean ± SEM. (L) Multivariate logistic regression between response to nivolumab and mRNA expression of the indicated genes or mutational load. (J and L) Patients were stratified into responders (complete response and partial response, n = 10) and nonresponders (stable disease or progressive disease, n = 39). The data set was obtained from GSE91061.
Figure 7
Figure 7. Roles of IL-32 in the antitumor immune response.
In melanoma, IL-32 is mainly produced by T cells. Injections of IL-32 improve DC function and trigger M1 polarization as well as CCL5 release in macrophages, resulting in CCR5-mediated CD8+ T cell infiltration into the TME and the eradication of cancer cells. Accordingly, IL-32 treatment has antitumorigenic functions in murine cancer models and positively correlates with overall survival of patients with melanoma. Moreover, it acts synergistically with anti–PD-1 therapy and strongly correlates with response to anti–PD-1 therapy in patients with melanoma.

Similar articles

Cited by

References

    1. Ribas A, Wolchok JD. Cancer immunotherapy using checkpoint blockade. Science. 2018;359(6382):1350–1355. doi: 10.1126/science.aar4060. - DOI - PMC - PubMed
    1. Sanmamed MF, Chen L. A Paradigm shift in cancer immunotherapy: from enhancement to normalization. Cell. 2018;175(2):313–326. doi: 10.1016/j.cell.2018.09.035. - DOI - PMC - PubMed
    1. Chen DS, Mellman I. Elements of cancer immunity and the cancer-immune set point. Nature. 2017;541(7637):321–330. doi: 10.1038/nature21349. - DOI - PubMed
    1. Trujillo JA, Sweis RF, Bao R, Luke JJ. T cell-inflamed versus non-T cell-inflamed tumors: a conceptual framework for cancer immunotherapy drug development and combination therapy selection. Cancer Immunol Res. 2018;6(9):990–1000. doi: 10.1158/2326-6066.CIR-18-0277. - DOI - PMC - PubMed
    1. Fridman WH, Zitvogel L, Sautès-Fridman C, Kroemer G. The immune contexture in cancer prognosis and treatment. Nat Rev Clin Oncol. 2017;14(12):717–734. doi: 10.1038/nrclinonc.2017.101. - DOI - PubMed

Publication types

MeSH terms