

Slowing Down of the Molecular Reorientation of Water in Concentrated Alkaline Solutions
- PMID: 32841025
- PMCID: PMC7520889
- DOI: 10.1021/acs.jpcb.0c03614
Slowing Down of the Molecular Reorientation of Water in Concentrated Alkaline Solutions
Abstract
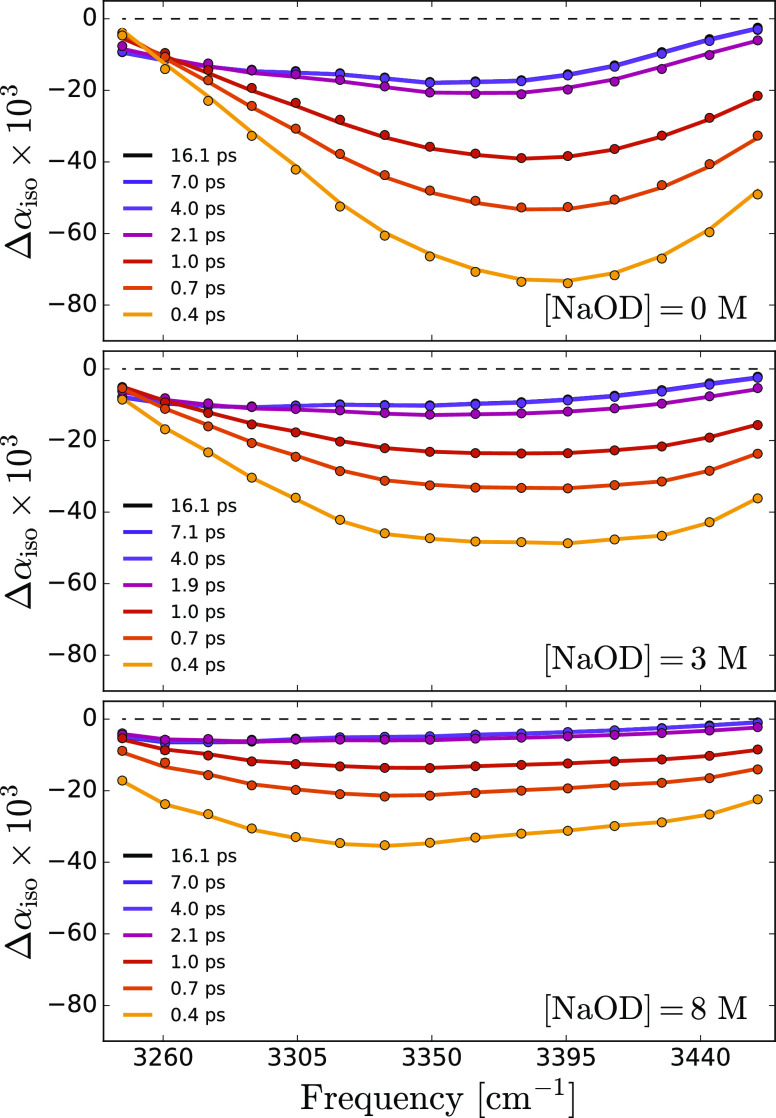
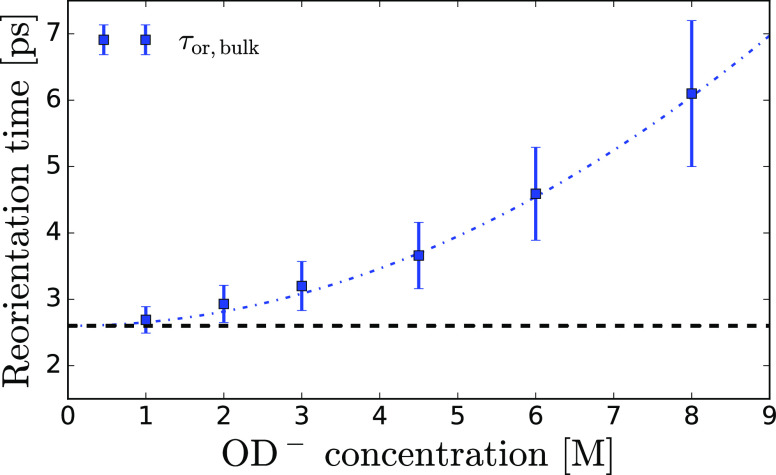
It is generally accepted that the hydroxide ion (OH-) is a strong hydrogen bond acceptor and that its anomalously high diffusion constant in water results from a Grotthuss-like structural diffusion mechanism. However, the spatial extent over which OH- ions influence the dynamics of the hydrogen-bond network of water remained largely unclear. Here, we measure the ultrafast dynamics of OH groups of HDO molecules interacting with the deuterated hydroxide ion OD-. For solutions with OD- concentrations up to 4 M, we find that HDO molecules that are not directly interacting with the ions have a reorientation time constant of ∼2.7 ps, similar to that of pure liquid water. When the concentration of OD- ions is increased, the reorientation time constant increases, indicating a strong slowing down of the structural dynamics of the solution.
Conflict of interest statement
The authors declare no competing financial interest.
Figures


Similar articles
-
Vibrational and orientational dynamics of water in aqueous hydroxide solutions.J Chem Phys. 2011 Sep 28;135(12):124517. doi: 10.1063/1.3643763. J Chem Phys. 2011. PMID: 21974545
-
Strong slowing down of water reorientation in mixtures of water and tetramethylurea.J Phys Chem A. 2008 Mar 20;112(11):2355-61. doi: 10.1021/jp077135c. Epub 2008 Feb 15. J Phys Chem A. 2008. PMID: 18275169
-
Water Dynamics and Structure of Highly Concentrated LiCl Solutions Investigated Using Ultrafast Infrared Spectroscopy.J Am Chem Soc. 2022 Mar 9;144(9):4233-4243. doi: 10.1021/jacs.2c00616. Epub 2022 Feb 28. J Am Chem Soc. 2022. PMID: 35226487
-
A first principles theoretical study of vibrational spectral diffusion and hydrogen bond dynamics in aqueous ionic solutions: D2O in hydration shells of Cl(-) ions.J Chem Phys. 2008 Nov 21;129(19):194512. doi: 10.1063/1.3006032. J Chem Phys. 2008. PMID: 19026071
-
Two-dimensional infrared spectroscopy of intermolecular hydrogen bonds in the condensed phase.Acc Chem Res. 2009 Sep 15;42(9):1220-8. doi: 10.1021/ar900006u. Acc Chem Res. 2009. PMID: 19425543 Review.
Cited by
-
Fluorescence of KCl Aqueous Solution: A Possible Spectroscopic Signature of Nucleation.J Phys Chem B. 2022 Apr 7;126(13):2564-2572. doi: 10.1021/acs.jpcb.2c01496. Epub 2022 Mar 28. J Phys Chem B. 2022. PMID: 35344657 Free PMC article.
-
Accelerated Vibrational Energy Relaxation of Water in Alkaline Environments.J Phys Chem B. 2021 Nov 4;125(43):11980-11986. doi: 10.1021/acs.jpcb.1c02730. Epub 2021 Oct 21. J Phys Chem B. 2021. PMID: 34672577 Free PMC article.
References
Publication types
LinkOut - more resources
Full Text Sources
