. 2020 Jul 24;6(30):eaaz2590.
doi: 10.1126/sciadv.aaz2590. eCollection 2020 Jul.

SirT7 auto-ADP-ribosylation regulates glucose starvation response through mH2A1

Affiliations

SirT7 auto-ADP-ribosylation regulates glucose starvation response through mH2A1

Nicolás G Simonet et al. Sci Adv. .

Abstract

Sirtuins are key players of metabolic stress response. Originally described as deacetylases, some sirtuins also exhibit poorly understood mono-adenosine 5'-diphosphate (ADP)-ribosyltransferase (mADPRT) activity. We report that the deacetylase SirT7 is a dual sirtuin, as it also features auto-mADPRT activity. SirT7 mADPRT occurs at a previously undefined active site, and its abrogation alters SirT7 chromatin distribution. We identify an epigenetic pathway by which ADP-ribosyl-SirT7 is recognized by the ADP-ribose reader mH2A1.1 under glucose starvation, inducing SirT7 relocalization to intergenic regions. SirT7 promotes mH2A1 enrichment in a subset of nearby genes, many of them involved in second messenger signaling, resulting in their specific up- or down-regulation. The expression profile of these genes under calorie restriction is consistently abrogated in SirT7-deficient mice, resulting in impaired activation of autophagy. Our work provides a novel perspective on sirtuin duality and suggests a role for SirT7/mH2A1.1 axis in glucose homeostasis and aging.


Figures

Fig. 1
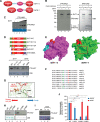
Fig. 1. SirT7 harbors an mADPRT activity that is catalyzed by an alternative domain.
(A) Secondary structure of the conserved domain in mammalian sirtuins. Differences in α helix length between SirT1 to SirT5 and SirT6 to SirT17 are shown in blue. (B) In vitro ADPRT assay of SirT7 purified from human embryonic kidney (HEK) 293F cells ± [32P]-NAD+ with purified HeLa core histones. Autoradiography ([32P]-NAD+) and Coomassie blue staining are shown. CBB, Coomassie Brilliant Blue. (C) SirT7 titration in ADPRT assay as in (B). (D) Top: Schematic representation of SirT7 and SirT6 proteins tested. Bottom: ADPRT assay performed as in (B) and (C) with the indicated proteins. (E) Structural comparison of SirT1 to SirT5 (magenta) and SirT6 and SirT7 (green) conserved domains. The primary catalytic (cat.) site with a bound acetylated peptide is shown in red, while the α helix bundle missing in SirT6 and SirT7 is shown in cyan. Loss of this region induces the formation of a cavity in SirT6 and SirT7 (red square). (F) Alignment of the sequence present in the cavity in the SirT6 and SirT7 lineage. E185, H187, and N189 are shown in green, blue, and red, respectively. (G) Molecular model of the SirT7 catalytic domain based on the crystal structure of SirT6. H187 is oriented toward the NAD+ molecule (orange) and the acetylated substrate (red). E185 and N189 are located in the same loop as H187 although pointing in the opposite direction. (H and I) In vitro auto-ADPRT assay of SirT7 proteins purified from HEK293F cells. (J) Deacetylation and ADPRT activity of the indicated proteins. The mADPRT and deacetylation activities were quantified from assays as in (H) and as in fig. S1H, respectively. For the deacetylation reaction, the indicated proteins were incubated with hyperacetylated core histones purified from HeLa cells and the deacetylation of H3K18ac was monitored by Western blot. Quantifications of both activities (n = 3) are shown relative to WT SirT7 activity (*P < 0.05, **P < 0.01, and ***P < 0.005).
Fig. 2
Fig. 2. SirT7 N189-dependent auto–ADP-ribosylation regulates SirT7 distribution and chromatin-binding dynamics.
(A) In vitro auto-mADPRT assay as in Fig. 1 with bacterially expressed rSirT6 WT or N135Q. (B) Deacetylation reaction with the recombinant bacterial SirT6 WT, N135Q, and H133Y incubated with recombinant mononucleosomes acetylated in H3K18ac (*P < 0.05). Quantification of three experiments similar to the one shown in fig. S2A. The results are represented relative to WT SirT7 activity (100%). (C) ADP-ribosylation levels of SirT7 WT or N189A expressed in HEK293F cells monitored by far Western blot with anti–pan–ADP-ribose binding reagent. HDAC, histone deacetylase. (D) Analysis of SirT7 auto-mADPRTion identified by MS. ADP-ribosylated peptides identified in SIRT7 WT or N189A after incubation with NAD+ were analyzed using high-energy collisional dissociation (HCD) and electron-transfer/higher-energy collision dissociation fragmentation methods. The most probable ADP-ribosylated sites are highlighted in red, as the modification cannot be localized with 100% confidence. Further information is included in table S1 and in Materials and Methods. (E) Structural model of the SirT7 catalytic domain indicating localization of the ADP-ribosylated peptides identified in (C). The ADP-ribosylation N189-dependent (magenta) and N189-independent (orange) residues, the N189/E185 cavity (blue), and the primary catalytic site bound to acetylated peptide (red) are shown. (F) IF assay of the indicated green fluorescent protein (GFP)–tagged SIRT7 proteins expressed in SirT7−/− MEFs. Nucleophosmin (B23) was included as a nucleolar marker. DAPI, 4′,6-diamidino-2-phenylindole. A representative image of the experiment is shown. Scale bar, 5 μm. (G) Quantification of IF experiment in (F), indicating the percentage of GFP-positive cells with a regular nucleolar distribution (*P < 0.05). (H) Cellular distribution of SirT7 WT, H187Y (HY), N189A (NA), and N189Q (NQ) in whole-cell extract (WCE), cytoplasm, nucleoplasm, and chromatin in NIH3T3 cells. Controls for the nuclear fraction (fibrillarin), cytoplasm (tubulin), and chromatin (histone H3) are also shown.
Fig. 3
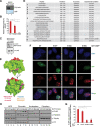
Fig. 3. SirT7 interacts with mH2A1.1 upon GS in an ADP-ribosylation–dependent manner.
(A) Affinity purification of SirT7-binding factors identified the histone H2A variant mH2A1 by MS analysis (table S2). HA, hemagglutinin. (B) Schematic representation of the three mH2A isoforms, of which, only mH2A1.1 binds to ADP-ribose (7). (C) Endogenous SirT7 specifically immunoprecipitates mH2A1.1 in HEK293F cells. IgG, immunoglobulin G. (D and E) mH2A1.1 recognizes and binds ADP-ribosylated SirT7. Immunoprecipitation (IP) of bacterially expressed rSirT7 WT or N189A preincubated ± NAD+ and added to nuclear extracts of HEK293F SirT7 KO cells (CRISPR-Cas9–mediated KO of SIRT7) expressing mH2A1.1 WT or G224E, a mutant deficient in ADP-ribose binding. Inputs (I) and elutions (E) are shown. A similar experiment with H187Y is shown in fig. S3A. (F) Top: Interaction between endogenous SirT7 and mH2A1.1 under high-stringency conditions upon different types of stress in HEK293 cells. C, untreated; IR, 7-gray ionizing irradiation; H2O2, oxidative stress. Western blot of the input and elution of immunoprecipitation experiments with anti-SirT7 antibody under these conditions. Bottom: Summary of the ADP-ribosylation events detected by MS in SirT7-FLAG expressed in the same cells and purified under the same stress conditions. Further details are shown in table in fig. S3B and in table S1. (G) Superose 6 gel filtration chromatography of nuclear endogenous proteins from nuclear extracts of HEK293F cells under normal cell growth (NT) or upon GS. Fraction numbers and approximate molecular weights (MW) are indicated. Western blot of SirT7 and mH2A1.1 are shown. (H) High-stringency immunoprecipitation of endogenous mH2A1.1 by WT or N189A SirT7 in HEK293F cells treated under normal conditions or under GS. Inputs (I) and elutions (E) are shown.
Fig. 4
Fig. 4. mH2A1 recruits SirT7 to distal intergenic regions associated with metabolic genes upon GS.
(A) Levels of three mH2A isoforms in WCE of NIH3T3 cells transfected with scramble shRNA or mH2A1 shRNA and cultured under normal or GS conditions. (B) Levels of endogenous SirT7 and histone H3 in chromatin and nucleoplasm fractions purified from Wt and Sirt7−/− MEFs cultured under normal or GS conditions during the indicated times. (C) Venn diagrams showing the intersection of SIRT7-associated genes with mH2A1-enriched genes in Wt cells under NT (top) or GS (bottom). SirT7-associated and mH2A1-enriched genes were derived from GREAT analysis (fig. S3B and Materials and Methods). (D) Average enrichment of mH2A1 at all genes in Wt (left) or SirT7−/− MEF (right) cells under NT (black) or GS (red) conditions. Data are expressed as the log2 ratio of reads per kilobase of transcript per million mapped reads–normalized ChIP/input signals. (E) Distribution of sites occupied by SirT7 upon GS around the TSS by GREAT analysis. The values for each bin from the TSS are shown above each bar (TSS: −5 kb, 5 to 50 kb, 50 to 500 kb, and >500 kb). (F) KEGG cell signaling pathways for SirT7-associated genes mapped by GREAT analysis under GS in MEF cells. The signaling pathways were ranked by their combined score provided by Enrichr analysis. cGMP-PKG, guanosine 3′,5′-monophosphate–protein kinase G; cAMP, cyclic adenosine 3′,5′-monophosphate; TCA, tricarboxylic acid. (G) SirT7 ChIP-qPCR (quantitative polymerase chain reaction) analysis of SirT7 binding sites associated with mH2A1 at distal regions upon shRNA-mediated down-regulation of mH2A1 under normal and GS conditions in NIH3T3 cells. The amplified regions (red) and their distance to each gene are indicated in the upper part of each graph. Each SirT7 ChIP was normalized with respect to its own input. SEM from n = 4. Two-tailed t test (*P < 0.05 and ***P < 0.005).
Fig. 5
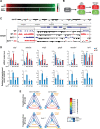
Fig. 5. SirT7 dual activity promotes mH2A1 enrichment in the promoters of associated genes, resulting in transcription up-regulation or down-regulation.
(A) Heat map showing RNA expression changes relative to NT (as log2 magnitude of difference between GS and NT) conditions in Wt and SirT7-deficient MEFs. (B) Pipeline applied to RNA-seq data to filter genes associated with SirT7/mH2A1 in Wt and Sirt7−/− MEF cells treated under GS or NT. The analysis was restricted to genes that (i) were associated with SirT7 via GREAT and were mH2A1-enriched, (ii) showed a log2 fold change (FC) of expression between WT-GS and WT-NT >0.6, and (iii) showed a difference between WT and KO log2 FC (GS versus NT) of >0.3 (table S3). (C) mH2A1 ChIP-seq signals across ctgf, a gene differentially enriched in mH2A1 upon GS in Wt MEFs compared with NT. (D) Top: Real-time qPCR (RT-qPCR) analysis of genes regulated by SirT7 upon GS and NT. The expression of SirT7 in SirT7−/− MEFs was rescued by retroviral-mediated gene transfer of SirT7 WT, H187Y(HY), N189A(NA), and empty vector (−). SEM from n = 4. Two-tailed t tests (*P < 0.05, **P < 0.01, ***P < 0.005, and ****P < 0.001). Bottom: Relative mH2A1 enrichment (GS versus NT) by ChIP-qPCR analysis at specific regions around the TSS of the indicated genes [gbp6, −6 kb; necab1, −3 kb; lair1, −27.5 kb; ctgf, +600 base pairs (bp); adra2a, −5 kb; and nrip3, +7 kb]. SEM from n = 3. One-way analysis of variance (ANOVA) (*P <0.05, **P < 0.01, and ***P < 0.005). a.u., arbitrary units. (E) Chromatin state transitions induced by GS in Wt and SirT7-deficient cells. The colors of the arrows indicate the frequency (%) of the transition as stated in the color scale (right). Bottom right: State map illustrating the specific combination of mH2A1 and/or H3K27me3 in the four chromatin states defined in the analysis. U1, without H3K27me3 or mH2A1; U2, mH2A1; U3, H3K27me3; U4, enriched by H3K27me3 and mH2A1.
Fig. 6
Fig. 6. SirT7 and mH2A1 axis plays a key role in CR.
(A) Model validation studies in WT and Sirt7−/− mice fed AL or calorie restricted (CR, 30%) for 8 weeks. (B) RT-qPCR analysis of the indicated genes in liver samples from Wt and Sirt7−/− mice fed AL or CR. Three animals were analyzed for each condition. Each quantification was generated from three replicates. Probabilities are those associated with one-way ANOVA (*P < 0.05, **P < 0.01, and ***P < 0.005). (C) Levels of SirT7 in liver samples from Wt and Sirt7−/− mice AL and CR after subcellular fractionation. WCE and chromatin fractions are shown. (D) SirT7 immunoprecipitation of mH2A1 in the same liver samples. Inputs (I) and elutions (E) are shown. (E) Autophagy activity in the Wt and Sirt7−/− livers under AL or CR monitored by levels of formation of LCIII-2. Left: A representative Western blot of n = 5 replicates used in the quantification shown. Right: Quantification of the relative accumulation of LCIII-2 compared to glyceraldehyde-3-phosphate dehydrogenase (GAPDH) analyzed with a two-tailed t test (*P < 0.05). GAPDH was used as a loading control, as we did not detect a significant alteration of the levels of the protein in our conditions (data not shown). (F) Similar analysis (n = 5) of Beclin-1 as in (E). (G) Model proposed for the dual SirT7/mH2A regulatory axis in GS. On the basis of our data, we speculate that this axis is also involved in CR and aging. Nutrient stress induces SirT7 auto-mADPRT, which leads to mH2A-dependent recruitment of SirT7 to distal regulatory regions and subsequent mH2A enrichment around the associated genes. This axis plays a key role in CR in vivo and possibly in aging by modulating key signaling pathways.

Similar articles

Cited by

References

    1. Bosch-Presegué L., Vaquero A., Sirtuins in stress response: Guardians of the genome. Oncogene 33, 3764–3775 (2014). - PubMed
    1. Martínez-Redondo P., Vaquero A., The diversity of histone versus nonhistone sirtuin substrates. Genes Cancer 4, 148–163 (2013). - PMC - PubMed
    1. Jiang H., Khan S., Wang Y., Charron G., He B., Sebastián C., Du J., Kim R., Ge E., Mostoslavsky R., Hang H. C., Hao Q., Lin H., SIRT6 regulates TNF-α secretion through hydrolysis of long-chain fatty acyl lysine. Nature 496, 110–113 (2013). - PMC - PubMed
    1. Caban C. E., Ginsburg A., Glutamine synthetase adenylyltransferase from Escherichia coli: Purification and physical and chemical properties. Biochemistry 15, 1569–1580 (1976). - PubMed
    1. Nureki O., Vassylyev D. G., Tateno M., Shimada A., Nakama T., Fukai S., Konno M., Hendrickson T. L., Schimmel P., Yokoyama S., Enzyme structure with two catalytic sites for double-sieve selection of substrate. Science 280, 578–582 (1998). - PubMed

Publication types