. 2020 Sep 8;117(36):22225-22236.
doi: 10.1073/pnas.2000417117. Epub 2020 Aug 21.

LIN28B/ let-7 control the ability of neonatal murine auditory supporting cells to generate hair cells through mTOR signaling

Affiliations

LIN28B/ let-7 control the ability of neonatal murine auditory supporting cells to generate hair cells through mTOR signaling

Xiao-Jun Li et al. Proc Natl Acad Sci U S A. .

Abstract

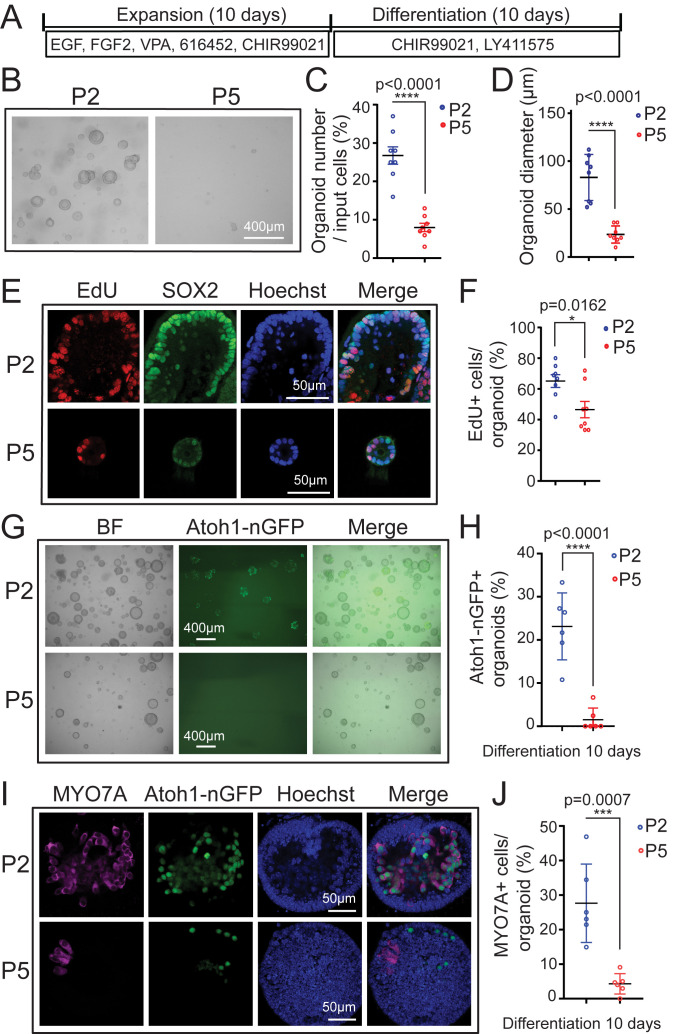
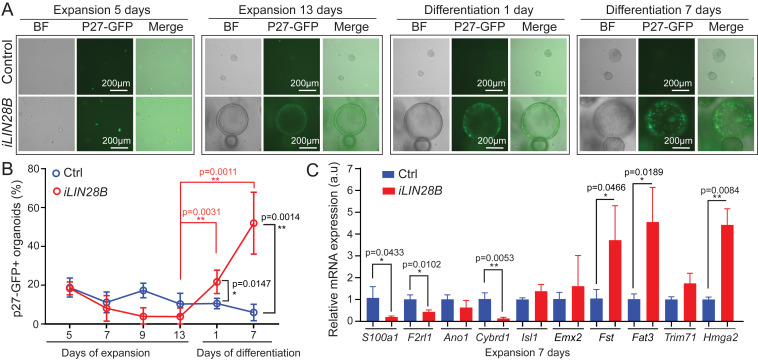
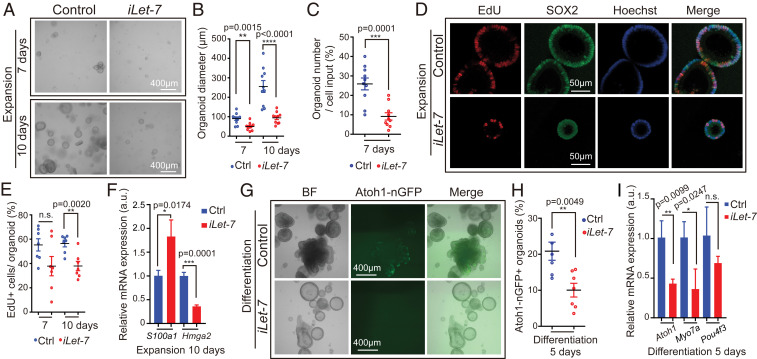
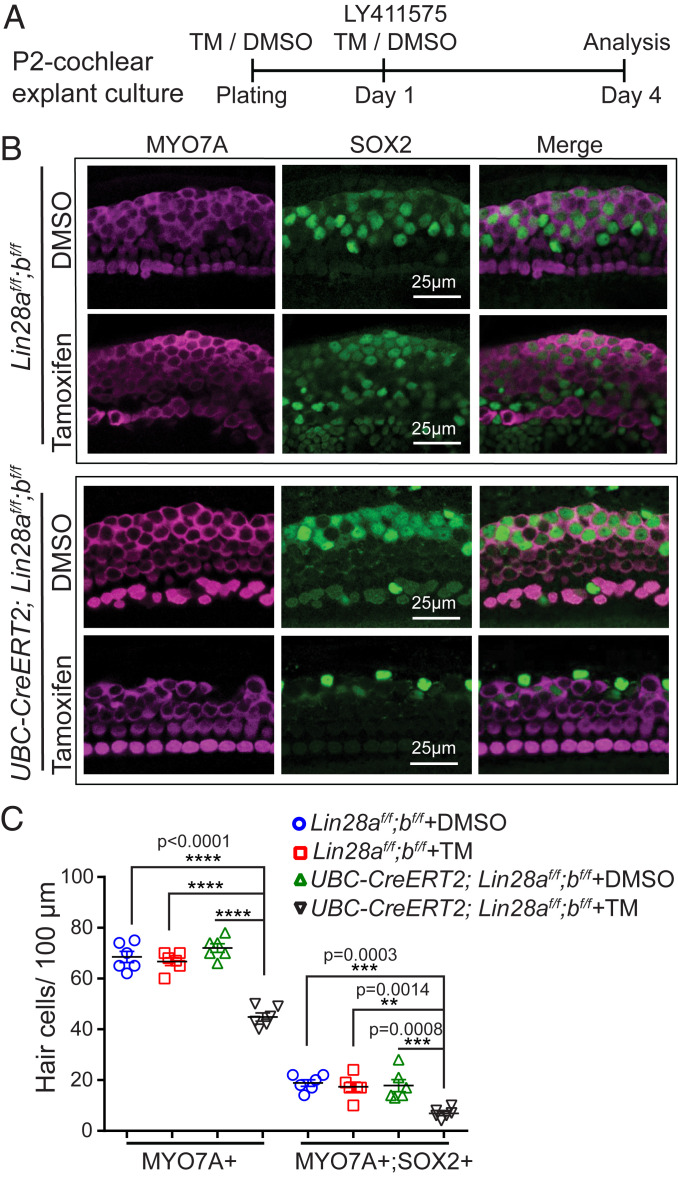
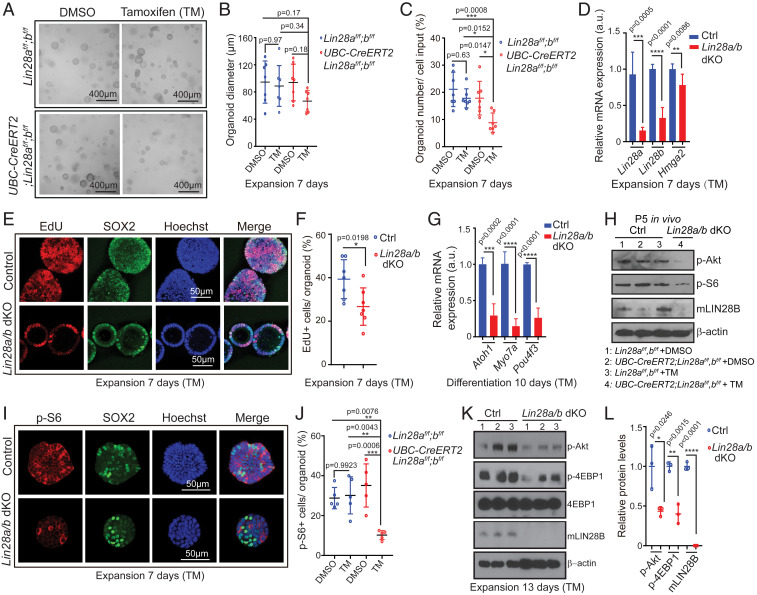
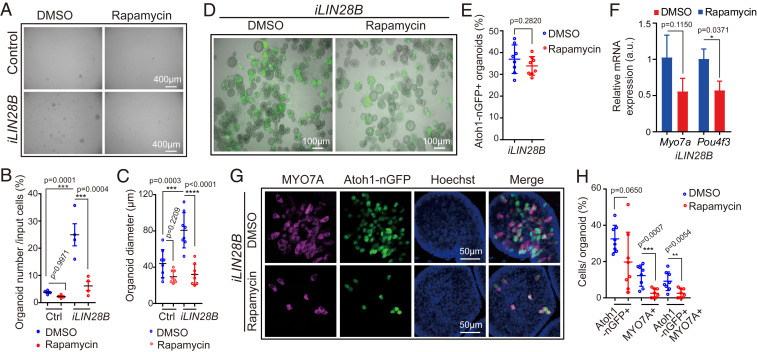
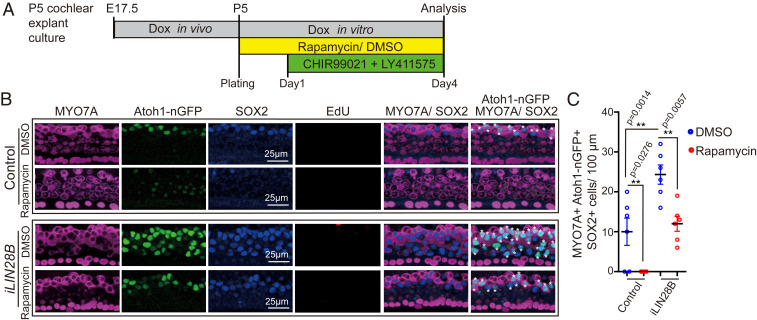
Mechano-sensory hair cells within the inner ear cochlea are essential for the detection of sound. In mammals, cochlear hair cells are only produced during development and their loss, due to disease or trauma, is a leading cause of deafness. In the immature cochlea, prior to the onset of hearing, hair cell loss stimulates neighboring supporting cells to act as hair cell progenitors and produce new hair cells. However, for reasons unknown, such regenerative capacity (plasticity) is lost once supporting cells undergo maturation. Here, we demonstrate that the RNA binding protein LIN28B plays an important role in the production of hair cells by supporting cells and provide evidence that the developmental drop in supporting cell plasticity in the mammalian cochlea is, at least in part, a product of declining LIN28B-mammalian target of rapamycin (mTOR) activity. Employing murine cochlear organoid and explant cultures to model mitotic and nonmitotic mechanisms of hair cell generation, we show that loss of LIN28B function, due to its conditional deletion, or due to overexpression of the antagonistic miRNA let-7g, suppressed Akt-mTOR complex 1 (mTORC1) activity and renders young, immature supporting cells incapable of generating hair cells. Conversely, we found that LIN28B overexpression increased Akt-mTORC1 activity and allowed supporting cells that were undergoing maturation to de-differentiate into progenitor-like cells and to produce hair cells via mitotic and nonmitotic mechanisms. Finally, using the mTORC1 inhibitor rapamycin, we demonstrate that LIN28B promotes supporting cell plasticity in an mTORC1-dependent manner.

Keywords: LIN28; hair cell regeneration; inner ear cochlea; let-7 miRNA; mTOR pathway.


Conflict of interest statement

The authors declare no competing interest.

Figures

Fig. 1.
Fig. 1.
Cochlear epithelial cells from stage P5 mice fail to expand and produce hair cells in organoid culture. Organoid cultures were established from cochlear epithelia cells obtained from Atoh1-nGFP transgenic mice, stages P2 and P5. Atoh1-nGFP marks nascent hair cells. (A) Experimental design. (B) Brightfield (BF) images of P2 and P5 cochlear organoid cultures after 5 d of expansion. (C) Organoid forming efficiency in P2 (blue) and P5 (red) cultures in B (n = 8). (D) Organoid diameters in P2 (blue) and P5 (red) cultures in B (n = 8). (E) Cell proliferation in P2 and P5 organoids. A single EdU pulse was given at 5 d of expansion and EdU incorporation (red) was analyzed 1 h later. SOX2 (green) marks supporting cells/prosensory cells and Hoechst (blue) labels cell nuclei. (F) Percentage of EdU+ cells in P2 and P5 organoids in E (n = 8). (G) BF and green fluorescent images (Atoh1-nGFP) of P2 and P5 organoid cultures after 10 d of differentiation. (H) Percentage of Atoh1-nGFP+ organoids in G (n = 6). (I) Confocal images of P2 and P5 organoid cultures after 10 d of differentiation. Newly formed hair cells express Atoh1-nGFP (green) and MYO7A (magenta). (J) Percentage of MYO7A+ hair cells per organoid in I (n = 6). Graphed are individual data points and mean ± SD. Individual data points in D, F, and J represent the average value per animal. n = animals analyzed per group. All data are from two independent experiments. Two-tailed, unpaired Student’s t tests were used to calculate P values.
Fig. 2.
Fig. 2.
LIN28B overexpression promotes cochlear epithelial cell expansion and hair cell production. Cochlear organoid cultures were established from stage P5 Atoh1-nGFP;iLIN28B transgenic mice and control littermates that lacked the LIN28B transgene. Atoh1-nGFP marks nascent hair cells. (A) Experimental strategy. (B) BF images of control and LIN28B overexpressing (iLIN28B) organoid cultures at 7 and 13 d of expansion. (C) Organoid forming efficiency in control (Ctrl, blue) and LIN28B (iLIN28B, red) overexpressing cultures (n = 6, two independent experiments). (D) Organoid diameters in control (Ctrl, blue) and LIN28B (iLIN28B, red) overexpressing cultures after 7 and 13 d of expansion (n = 12, two independent experiments). (E) qRT-PCR analyzing Sox2 mRNA expression in control (Ctrl, blue bar) and LIN28B overexpressing (iLIN28B, red bar) organoids at 7 and 13 d of expansion (n = 3, from one representative experiment, three independent experiments). (F) Cell proliferation in control and LIN28B overexpressing organoids. An EdU pulse was given at 7 d (shown) or 13 d of expansion and EdU incorporation (red) was analyzed 2 h later. SOX2 (green) marks supporting cells/prosensory cells, Hoechst labels cell nuclei (blue). (G) Percentage of EdU+ cells in control (Ctrl, blue) and LIN28B overexpressing (iLIN28B, red) organoids at 7 and 13 d of expansion (n = 6, two independent experiments, n.s. not significant). (H) EdU incorporation in SOX2-high and SOX2-low expressing cells (n = 4, two independent experiments). Note that the majority of EdU+ cells in LIN28B overexpressing organoids expressed SOX2 at a low level (red, SOX2low EdU+). (I) BF and green fluorescent (Atoh1-nGFP) images of control and LIN28B overexpressing organoids after 8 d of differentiation. (J) Percentage of Atoh1-nGFP+ organoids in control (Ctrl) and LIN28B overexpressing (iLIN28B) cultures after 3, 5, and 8 d of differentiation (n = 6, two independent experiments). (K) qRT-PCR analyzing hair cell-specific mRNA expression (Atoh1, Myo7a, Pou4f3) in control (Ctrl, blue bar) and LIN28B overexpressing (iLIN28B, red bar) organoids after 5 d of differentiation (n = 3, from one representative experiment, three independent experiments). Bars in E and K represent mean ± SD, otherwise individual data points and their mean ± SD were plotted. Individual data points in D, G, and H represent the average value per animal. n = animals analyzed per group. Two-tailed, unpaired Student’s t test was used to calculate P values. a.u., arbitrary unit.
Fig. 3.
Fig. 3.
LIN28B overexpression promotes supporting cell de-differentiation. Cochlear organoid cultures were established from stage P5 iLIN28B transgenic mice and control littermates that lacked the LIN28B transgene. Cochlear organoid cultures were maintained as outlined in Fig. 2A. P27-GFP transgene expression was used to monitor postmitotic supporting cells in A and B. (A) Representative BF and green fluorescent images of p27-GFP expression in LIN28B overexpressing and control organoid cultures at 5 and 13 d of expansion and 1 and 7 d of differentiation. (B) Percentage of p27-GFP+ organoids in A (mean ± SD, n = 7, two independent experiments). (C) qRT-PCR analyzing supporting cell-specific (S100a1, F2rl1, Ano1, Cybrd1), prosensory cell-specific (Fst, Fat3, Hmga2, Trim71) mRNA expression in control (Ctrl, blue bar) and LIN28B overexpressing (iLIN28B, red bar) organoids at 7 d of expansion. Emx2 and Isl1 served as controls (mean ± SD, n = 3, from one representative experiment, three independent experiments). n = animals analyzed per group. Two-tailed, unpaired Student’s t test was used to calculate P values.
Fig. 4.
Fig. 4.
Let-7g overexpression inhibits proliferation and hair cell formation in cochlear organoid culture. Cochlear organoid cultures from stage P2 Atoh1-nGFP;iLet-7 transgenic mice and control littermates that lacked the let-7g transgene were maintained as outlined in Fig. 1A. (AF) Dox was present throughout expansion. (GI) Dox was added after 4 d of expansion and was present the remaining 6 d of expansion and 5 d of differentiation. (AE) Let-7g overexpression inhibits organoid formation and organoid expansion. (A) BF images of control and let-7g overexpressing organoid cultures after 7 and 10 d of expansion. (B) Diameter of control and let-7g overexpressing organoids in A (n = 10, three independent experiments). (C) Organoid forming efficiency of control and let-7g overexpressing organoids (n = 10, three independent experiments). (D) Cell proliferation in control and let-7g overexpressing organoids. A single EdU pulse was given at 7 or 10 d (shown) of expansion and EdU incorporation (red) was analyzed 1 h later. SOX2 (green) marked prosensory cells/supporting cells, Hoechst (blue) staining marked cell nuclei. (E) Percentage of EdU+ cells in D (n = 7, two independent experiments). (F) qRT-PCR analyzing S100a1 and Hmga2 mRNA expression in control and iLet-7 transgenic organoids at 10 d of expansion (n = 3, from one representative experiment, two independent experiments). (GI) Let-7g overexpression inhibits hair cell formation. (G) BF and green fluorescent images (Atoh1-nGFP) of control and let-7g overexpressing organoid cultures. (H) Percentage of Atoh1-nGFP+ organoids in G (n = 6 for control group, n = 7 for iLet-7 group, two independent experiments). (I) qRT-PCR analyzing hair cell-specific (Atoh1, Myo7a, Pou4f3) mRNA expression in control and let-7g overexpressing organoids after 5 d of differentiation (n = 3, from one representative experiment, two independent experiments). Bars in F and I represent mean ± SD, otherwise individual data points and their mean ± SD were plotted. Note that the individual data points in B and E represent the average values per animal. n = animals analyzed per group. Two-tailed, unpaired Student’s t test was used to calculate P values.
Fig. 5.
Fig. 5.
Loss of LIN28A/B inhibits supporting cell-to-hair cell conversion in response to Notch inhibition. (A) Experimental strategy. Cochlear explants from stage P2 UBC-CreERT2;Lin28af/f;Lin28bf/f mice and Lin28af/f;Lin28bf/f littermates were cultured in the presence of 4-hydroxy-tamoxifen (TM) or DMSO (vehicle control). At day 1 of culture, cochlear explants received Notch inhibitor LY411575 and 3 d later cochlear explants were analyzed for new hair cells. (B) Confocal images of midapical turn of control (TM: Lin28af/f;Lin28bf/f; DMSO: UBC-CreERT2;Lin28af/f;Lin28bf/f; DMSO: Lin28af/f;Lin28bf/f) and Lin28a/b dKO cochlear explants (TM: UBC-CreERT2;Lin28af/f;Lin28bf/f) immuno-stained for MYO7A (magenta) and SOX2 (green). (C) Quantification of total number of hair cells (MYO7A+) as well as newly formed hair cells (MYO7A+ SOX2+) for control (blue, red, green) and Lin28a/b dKO (black) in B. Graphed are individual data points, representing average values per animal, and mean ± SD for control (blue, red, green) and Lin28a/b dKO (black), n = 6 animals per group, two independent experiments. Two-way ANOVA with Tukey’s correction was used to calculate P values.
Fig. 6.
Fig. 6.
Loss of LIN28A/B attenuates mTOR signaling and limits supporting cell proliferation and hair cell formation in cochlear organoid culture. Cochlear organoid cultures were established from UBC-CreERT2;Lin28af/f;Lin28bf/f mice and Lin28af/f;Lin28bf/f littermates’ stage P2. Cultures received 4-hydroxy-tamoxifen (TM) or vehicle control DMSO at plating. SOX2 (green) marks supporting cells/prosensory cells, Hoechst (blue) staining marks cell nuclei. (AG) Loss of Lin28a/b inhibits cell proliferation and hair cell production in organoid culture. (A) Representative BF images of control organoids (TM: Lin28af/f;Lin28bf/f; DMSO: UBC-CreERT2;Lin28af/f;Lin28bf/f; DMSO: Lin28af/f;Lin28bf/f) and Lin28a/b dKO organoids (TM: UBC-CreERT2;Lin28af/f;Lin28bf/f) at 7 d of expansion. (B) Diameter of control and Lin28a/b dKO organoids in A (n = 7, two independent experiments). (C) Organoid forming efficiency in control and Lin28a/b dKO cultures (n = 7, two independent experiments). (D) qRT-PCR analyzing Lin28a, Lin28b and Hmga2 mRNA expression in Lin28a/b dKO organoids (red bar) compared to control organoids (blue bar) at 7 d of expansion (n = 5 for control, n = 6 for Lin28a/b dKO, two independent experiments). (E) Cell proliferation in control and Lin28a/b dKO organoids. An EdU pulse was given at 7 d of expansion and EdU incorporation (red) was analyzed 1 h later. (F) EdU incorporation in E (n = 7, two independent experiments). (G) qRT-PCR analysis of Atoh1, Myo7a, and Pou4f3 mRNA expression in Lin28a/b dKO organoids (red bar) compared to control organoids (blue bar) at 10 d of differentiation (n = 4, two independent experiments). (H) Immunoblots for LIN28B, p-Akt, p-S6, and β-actin using protein lysates of acutely isolated control and Lin28a/b dKO cochlear epithelia, stage P5. (IL) Loss of Lin28a/b attenuates mTOR signaling in cochlear organoids. (I) Immunostaining for p-S6 protein (red) in control and Lin28a/b dKO organoids at 7 d of expansion. (J) Percentage of p-S6+ cells in I (n = 5, two independent experiments). (K) Immunoblots for p-Akt, p-4EBP1, 4EBP1, mLIN28B, and β-actin (loading control) using protein lysates of control and Lin28a/b dKO organoids after 7 d of expansion. (L) Normalized p-Akt, p-4EBP1, and m-LIN28B protein levels in control and Lin28a/b dKO organoids in K (n = 3, from one representative experiment, two independent experiments). Bars in D and G represent mean ± SD, otherwise individual data points and their mean ± SD were plotted. Individual data points in B, F, and J represent the average values per animal. n = animals analyzed per group. Two-way ANOVA with Tukey’s correction was used to calculate P values in B, C, and J. Otherwise, P values were calculated using two-tailed, unpaired Student’s t tests.
Fig. 7.
Fig. 7.
Inhibition of mTOR signaling attenuates LIN28B-induced organoid growth and hair cell formation. Cochlear organoid cultures were established from stage P5 Atoh1-nGFP;iLIN28B transgenic mice and Atoh1-nGFP transgenic control littermates and maintained as outlined in Fig. 2A. (AC) Rapamycin attenuates LIN28B’s positive effect on cell growth in organoid culture. Rapamycin (4 ng/mL) or vehicle control (DMSO) was added at plating and replenished every other day. (A) BF images of control and LIN28B overexpressing (iLIN28B) organoids after expansion in the presence of DMSO or rapamycin for 7 d. (B) Organoid-forming efficiency in A (n = 4, two independent experiments). (C) Organoid diameters in A (n = 8, three independent experiments). (DH) Rapamycin attenuates LIN28B’s positive effect on hair cell formation in organoid culture. Rapamycin (4 ng/mL) or DMSO was present during the final phase of expansion (10 to 13 d) and during the 5 d of differentiation. (D) Merged BF and green fluorescent images (Atoh1-nGFP) of LIN28B overexpressing organoid cultures treated with DMSO or rapamycin. (E) Percentage of Atoh1-nGFP+ organoids in D (n = 8, two independent experiments). (F) qRT-PCR analyzing Myo7a and Pou4f3 mRNA expression in LIN28B overexpressing organoids treated with rapamycin (red bar) or DMSO (blue bar) (mean ± SD, n = 2, from one representative experiment, two independent experiments). (G) Confocal images of LIN28B overexpressing organoids cultured in the presence of rapamycin or DMSO. Newly formed hair cells are identified by their coexpression of Atoh1-nGFP (green) and MYO7A (magenta). Nuclei were counterstained with Hoechst (blue). (H) Percentage of GFP+ (Atoh1-nGFP), MYO7A+, and GFP+ MYO7A+ hair cells per organoid in G (n = 8, two independent experiments). Graphs in B, C, E, and H show individual data points and the mean ± SD. The individual data points in C, E, and H represent average value per animal. n = animals analyzed per group. Two-way ANOVA with Tukey’s correction was used to calculate P values in B and C. Otherwise, P values were calculated using two-tailed, unpaired Student’s t tests.
Fig. 8.
Fig. 8.
LIN28B promotes nonmitotic hair cell production in an mTOR-dependent manner. (A) Experimental strategy. Cochlear explant cultures were established from stage P5 Atoh1-nGFP iLIN28B transgenic and Atoh1-nGFP transgenic control littermates. Pregnant dams were fed dox containing food starting at E17.5 and dox was present during culture. EdU (3 µM) and rapamycin (4 ng/mL) or vehicle control DMSO was added at plating. CHIR99021 (3 μM) and LY411575 (5 μM) were added the next day. (B) Rapamycin treatment inhibits hair cell generation in control and LIN28B overexpressing cochlear explants. Shown are representative confocal images of the midapical turn of control and LIN28B overexpressing cochlear explants stained for MYO7A (magenta), Atoh1-nGFP (green), SOX2 (blue), and EdU (red). White asterisks mark newly formed hair cells. (C) Quantification of newly formed hair cells (MYO7A+ Atoh1-nGFP+ SOX2+) in B. Graphed are average values for each animal and the mean ± SD, n = 6 animals per group, two independent experiments, two-way ANOVA with Tukey’s correction was used to calculate P values.

Similar articles

Cited by

References

    1. Warchol M. E., Sensory regeneration in the vertebrate inner ear: Differences at the levels of cells and species. Hear. Res. 273, 72–79 (2011). - PubMed
    1. Fekete D. M., Muthukumar S., Karagogeos D., Hair cells and supporting cells share a common progenitor in the avian inner ear. J. Neurosci. 18, 7811–7821 (1998). - PMC - PubMed
    1. Driver E. C., Sillers L., Coate T. M., Rose M. F., Kelley M. W., The Atoh1-lineage gives rise to hair cells and supporting cells within the mammalian cochlea. Dev. Biol. 376, 86–98 (2013). - PMC - PubMed
    1. Kiernan A. E., et al. , Sox2 is required for sensory organ development in the mammalian inner ear. Nature 434, 1031–1035 (2005). - PubMed
    1. Ahmed M., et al. , Eya1-Six1 interaction is sufficient to induce hair cell fate in the cochlea by activating Atoh1 expression in cooperation with Sox2. Dev. Cell 22, 377–390 (2012). - PMC - PubMed

Publication types