

Phenolic Metabolites from Barley in Contribution to Phenome in soil Moisture Deficit
- PMID: 32825802
- PMCID: PMC7503775
- DOI: 10.3390/ijms21176032
Phenolic Metabolites from Barley in Contribution to Phenome in soil Moisture Deficit
Abstract
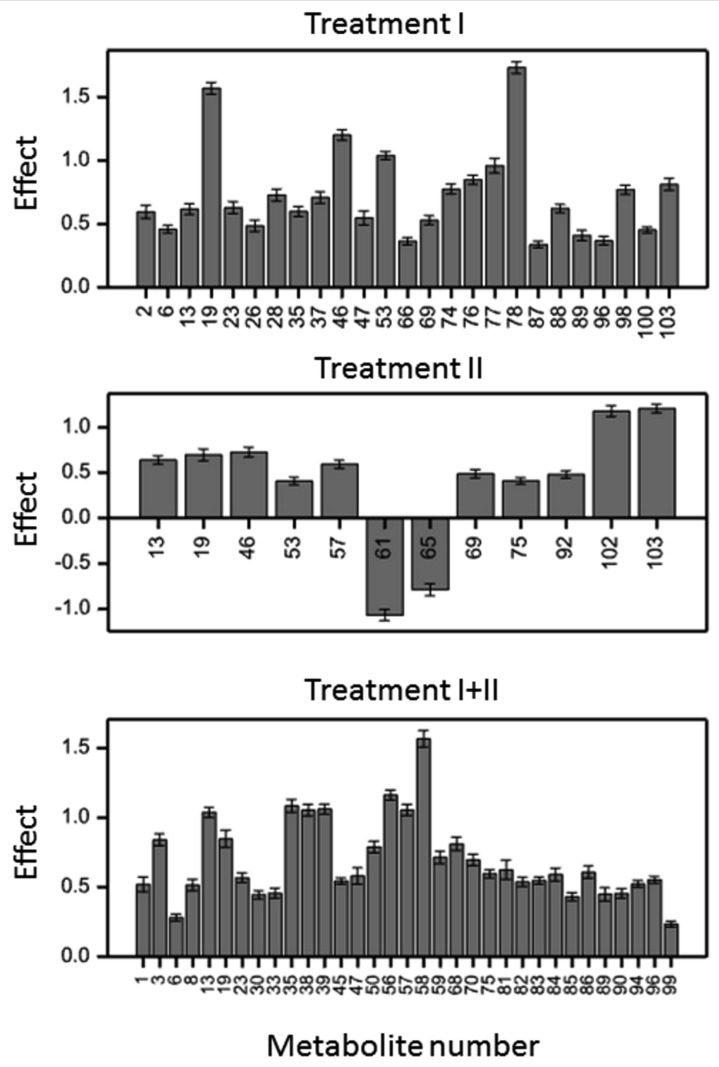
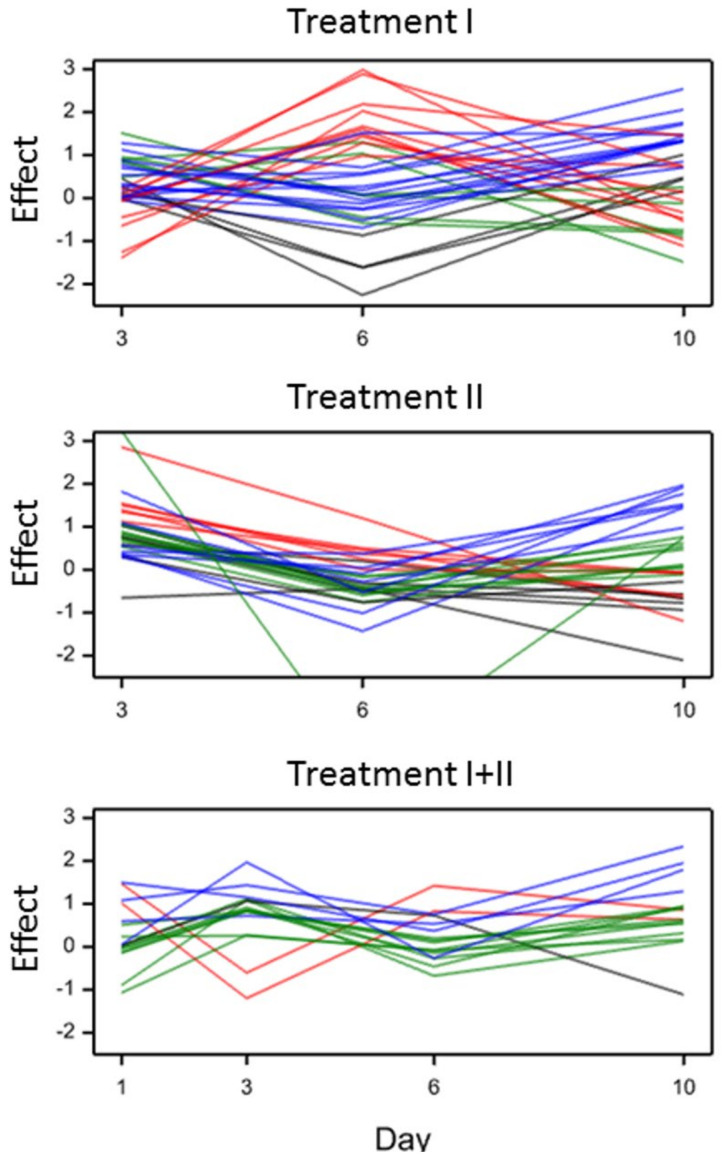
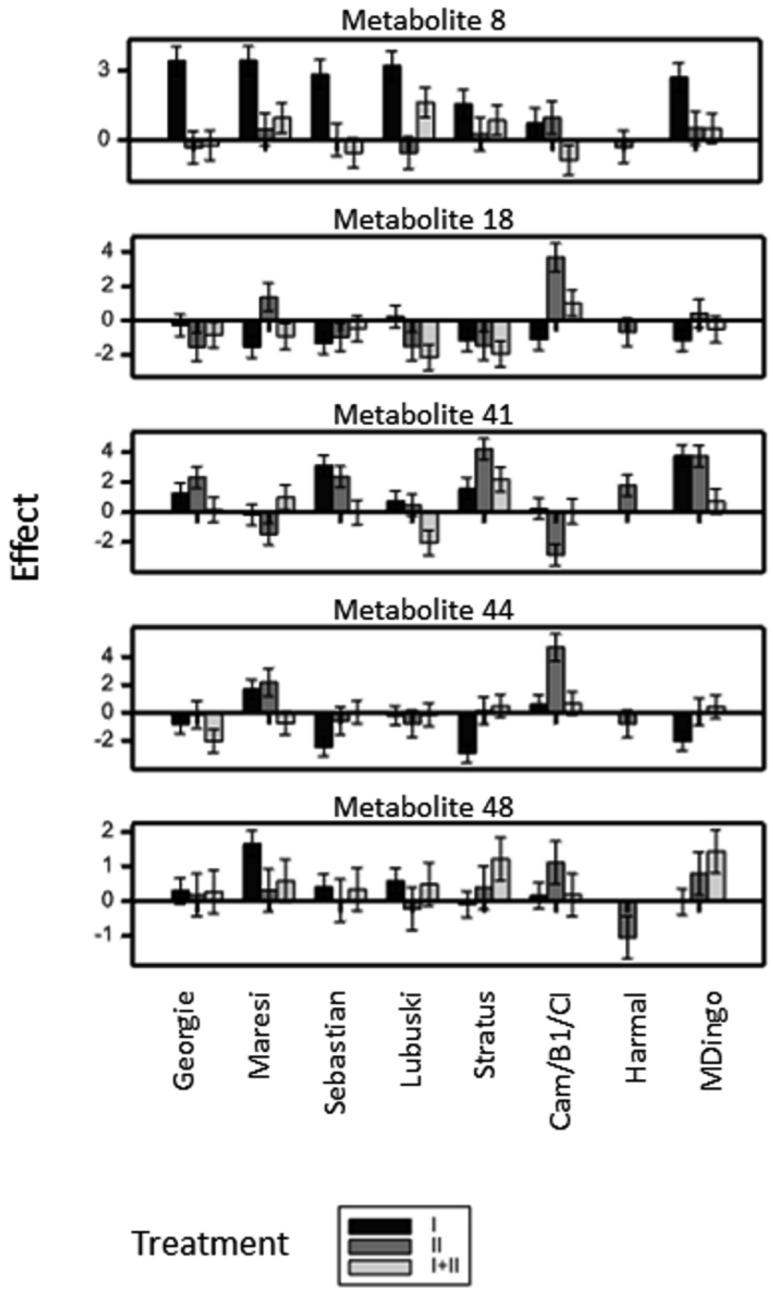
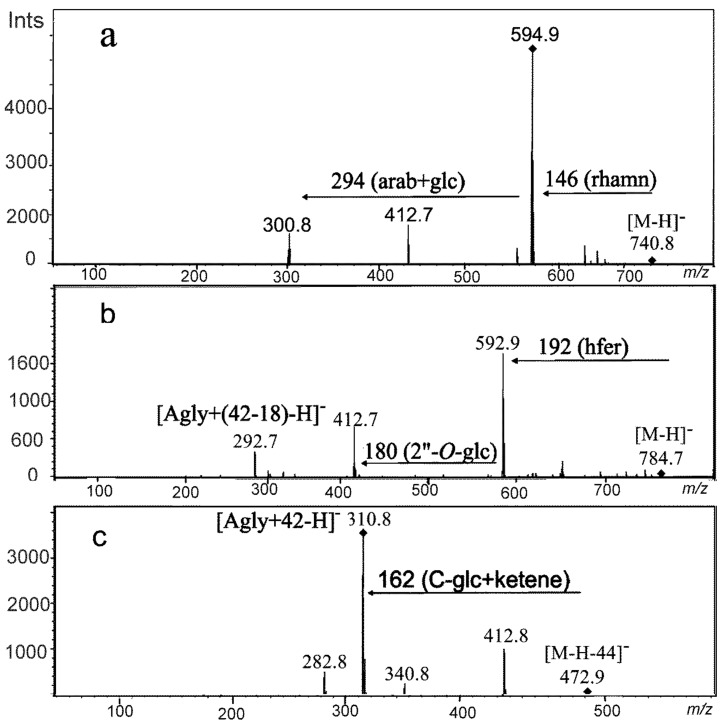
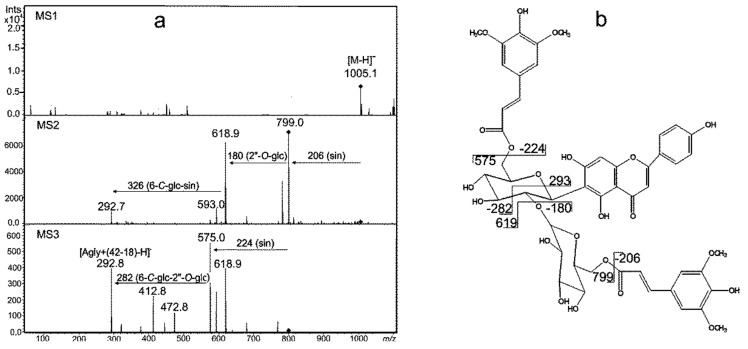
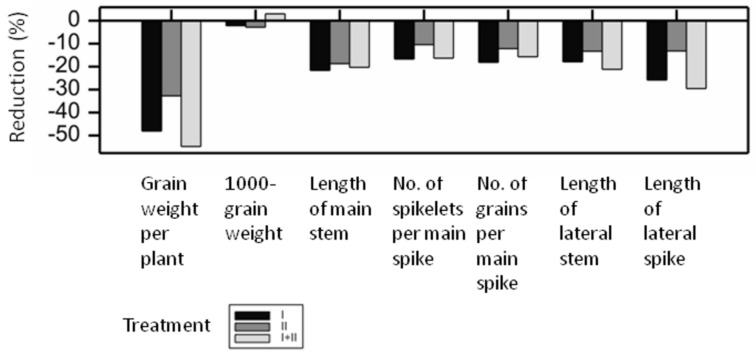
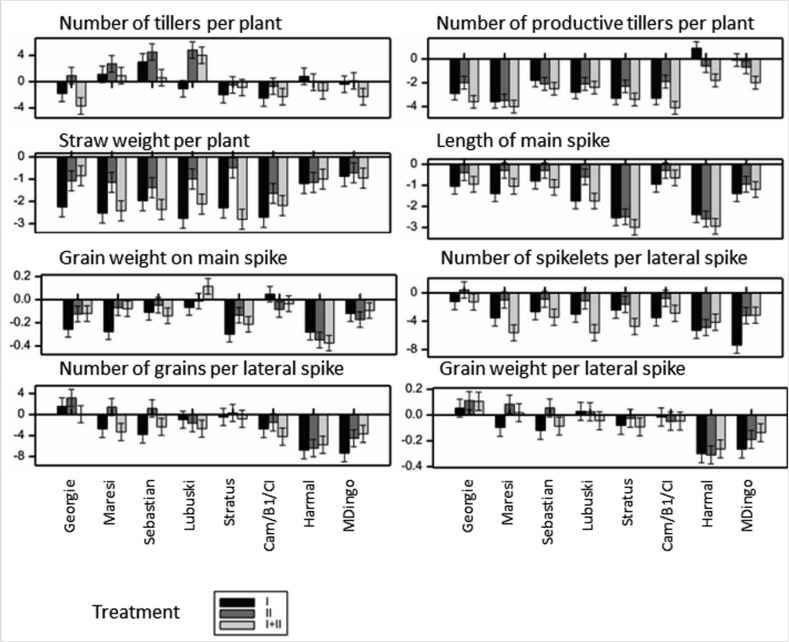
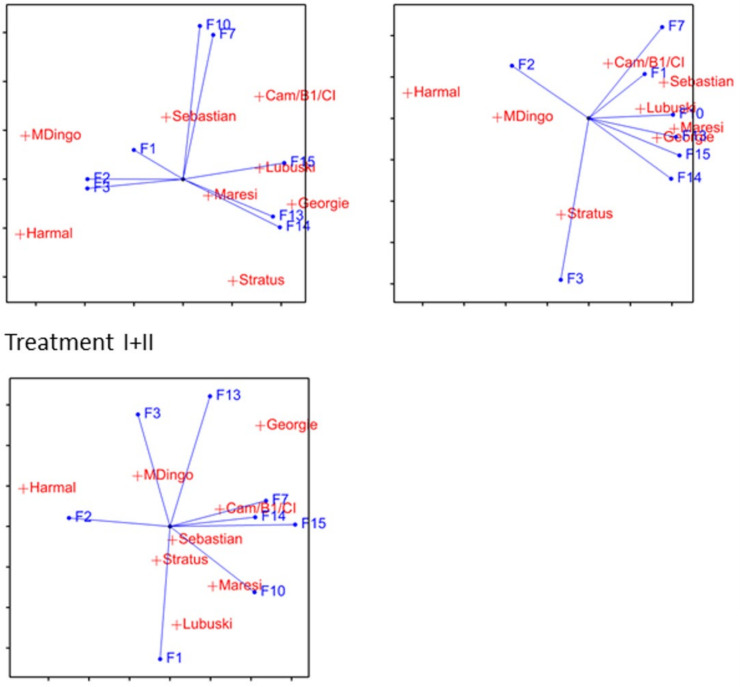
Eight barley varieties from Europe and Asia were subjected to moisture deficit at various development stages. At the seedling stage and the flag leaf stage combined stress was applied. The experiment was designed for visualization of the correlation between the dynamics of changes in phenolic compound profiles and the external phenome. The most significant increase of compound content in water deficiency was observed for chrysoeriol and apigenin glycoconjugates acylated with methoxylated hydroxycinnamic acids that enhanced the UV-protection effectiveness. Moreover, other good antioxidants such as derivatives of luteolin and hordatines were also induced by moisture deficit. The structural diversity of metabolites of the contents changed in response to water deficiency in barley indicates their multipath activities under stress. Plants exposed to moisture deficit at the seedling stage mobilized twice as many metabolites as plants exposed to this stress at the flag leaf stage. Specific metabolites such as methoxyhydroxycinnamic acids participated in the long-term acclimation. In addition, differences in phenolome mobilization in response to moisture deficit applied at the vegetative and generative phases were correlated with the phenotypical consequences. Observations of plant yield and biomass gave us the possibility to discuss the developmentally related consequences of moisture deficit for plants' fitness.
Keywords: barley; drought; mass spectrometry phenotyping; metabolomics.
Conflict of interest statement
The authors declare no conflict of interest.
Figures
Similar articles
-
Effect of some osmoregulators on photosynthesis, lipid peroxidation, antioxidative capacity, and productivity of barley (Hordeum vulgare L.) under water deficit stress.Environ Sci Pollut Res Int. 2018 Oct;25(30):30199-30211. doi: 10.1007/s11356-018-3023-x. Epub 2018 Aug 28. Environ Sci Pollut Res Int. 2018. PMID: 30155630
-
Drought-related secondary metabolites of barley (Hordeum vulgare L.) leaves and their metabolomic quantitative trait loci.Plant J. 2017 Mar;89(5):898-913. doi: 10.1111/tpj.13430. Epub 2017 Feb 11. Plant J. 2017. PMID: 27880018
-
Combined mass spectrometric and chromatographic methods for in-depth analysis of phenolic secondary metabolites in barley leaves.J Mass Spectrom. 2015 Mar;50(3):513-32. doi: 10.1002/jms.3557. J Mass Spectrom. 2015. PMID: 25800187
-
Drought effect on growth, gas exchange and yield, in two strains of local barley Ardhaoui, under water deficit conditions in southern Tunisia.J Environ Manage. 2012 Dec 30;113:495-500. doi: 10.1016/j.jenvman.2012.05.026. Epub 2012 Jul 4. J Environ Manage. 2012. PMID: 22766042
-
New phenotyping methods for screening wheat and barley for beneficial responses to water deficit.J Exp Bot. 2010 Aug;61(13):3499-507. doi: 10.1093/jxb/erq199. Epub 2010 Jul 6. J Exp Bot. 2010. PMID: 20605897 Review.
Cited by
-
Saponarin, a Di-glycosyl Flavone from Barley (Hordeum vulgare L.): An Effective Compound for Plant Defense and Therapeutic Application.ACS Omega. 2023 Jun 14;8(25):22285-22295. doi: 10.1021/acsomega.3c00267. eCollection 2023 Jun 27. ACS Omega. 2023. PMID: 37396229 Free PMC article. Review.
-
Separation of Chromatographic Co-Eluted Compounds by Clustering and by Functional Data Analysis.Metabolites. 2021 Mar 31;11(4):214. doi: 10.3390/metabo11040214. Metabolites. 2021. PMID: 33807374 Free PMC article.
References
-
- Aroca R. Plant. Responses to Drought Stress from Morphological to Molecular Features. Springer; Berlin/Heidelberg, Germany: 2012.
-
- Szira F., Bálint A.F., Börner A., Galiba G. Evaluation of drought-related traits and screening methods at different developmental stages in spring barley. J. Agron. Crop. Sci. 2008;194:334–342. doi: 10.1111/j.1439-037X.2008.00330.x. - DOI
-
- Wiegmann M., Maurer A., Pham A., March T.J., Al-Abdallat A., Thomas W.T.B., Bull H.J., Shahid M., Eglinton J., Baum M., et al. Barley yield formation under abiotic stress depends on the interplay between flowering time genes and environmental cues. Sci. Rep. 2019;9:6397. doi: 10.1038/s41598-019-42673-1. - DOI - PMC - PubMed
-
- Bowler K. Acclimation, heat shock and hardening. J. Therm. Biol. 2005;30:125–130. doi: 10.1016/j.jtherbio.2004.09.001. - DOI
MeSH terms
Substances
Grants and funding
LinkOut - more resources
Full Text Sources
Medical
