

Assessment of Interobserver Reliability of Nephrologist Examination of Urine Sediment
- PMID: 32821922
- PMCID: PMC7442930
- DOI: 10.1001/jamanetworkopen.2020.13959
Assessment of Interobserver Reliability of Nephrologist Examination of Urine Sediment
Abstract
Importance: Urine sediment microscopy is commonly performed during the evaluation of kidney disease. Interobserver reliability of nephrologists' urine sediment examination has not been well studied.
Objective: Assess interobserver reliability of the urine sediment examination.
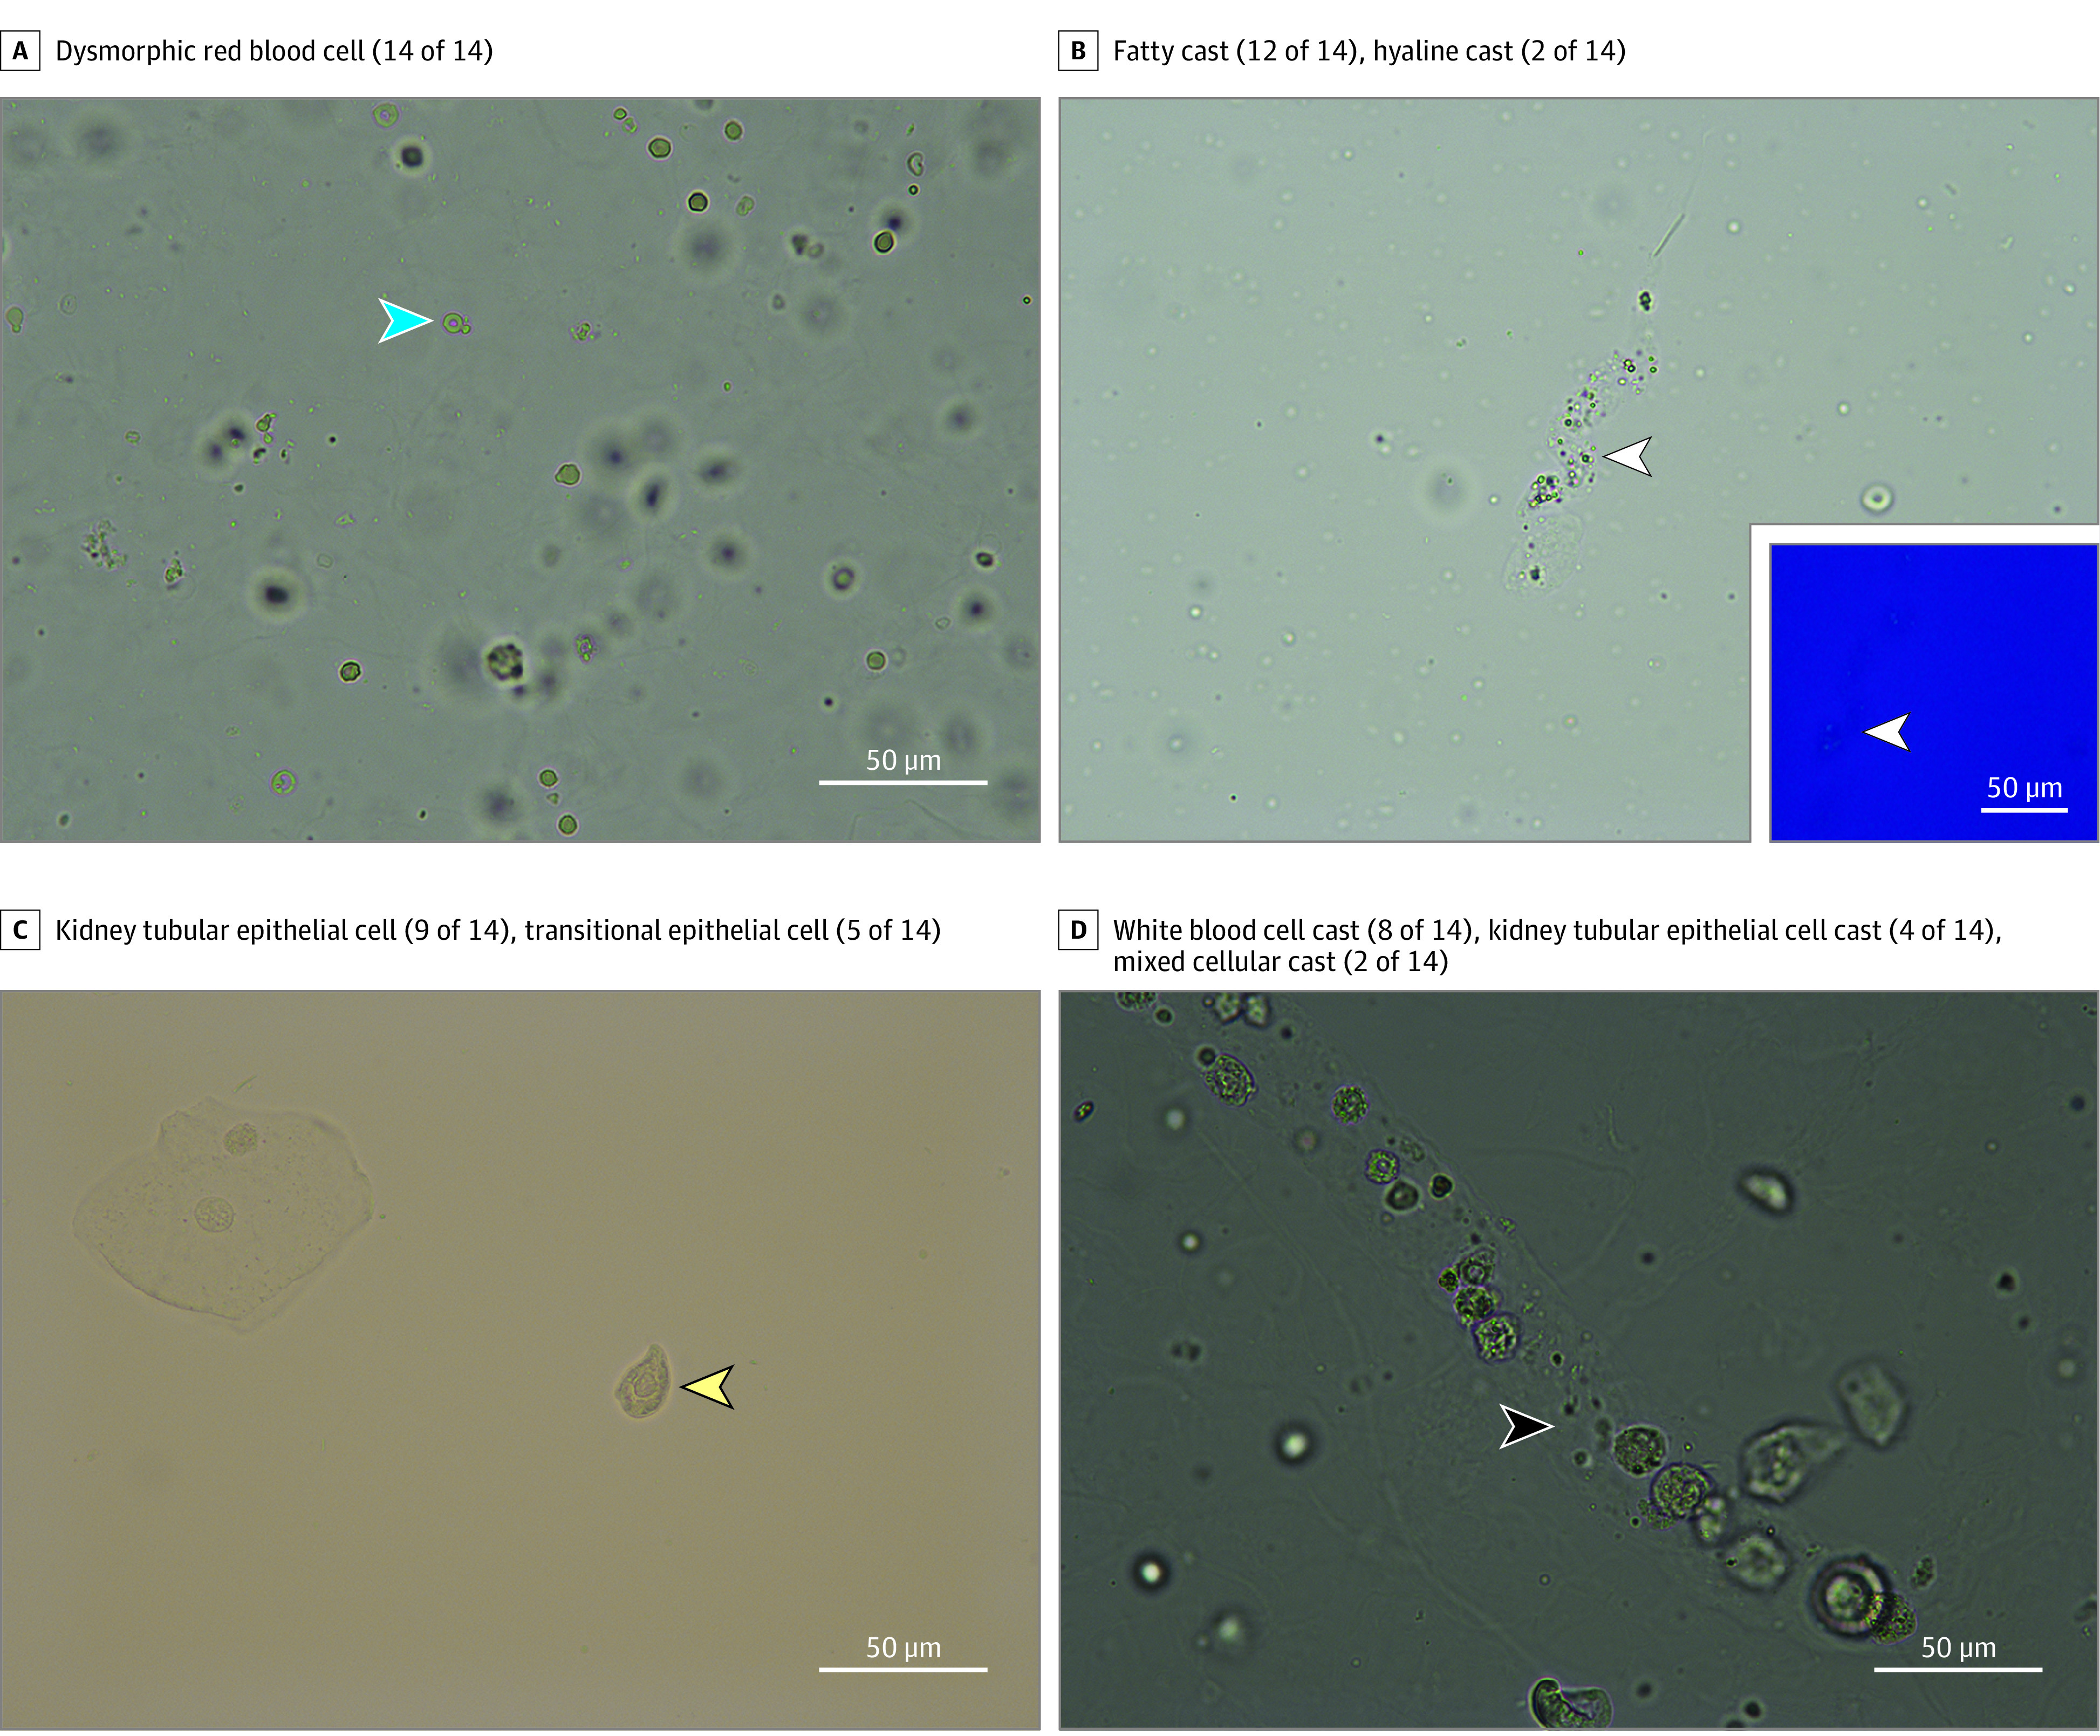
Design, setting, and participants: In this diagnostic test study, urine samples were prospectively collected from a convenience sample of adult patients from an academic hospital in the United States undergoing kidney biopsy from July 11, 2018, to March 20, 2019. Digital images and videos of urine sediment findings were captured using a bright-field microscope. These images and videos along with urine dipstick results were incorporated in online surveys and sent to expert nephrologists at 15 US teaching hospitals. They were asked to identify individual sediment findings and the most likely underlying disease process.
Exposures: Urine dipstick results and urine sediment images from patients undergoing native kidney biopsy.
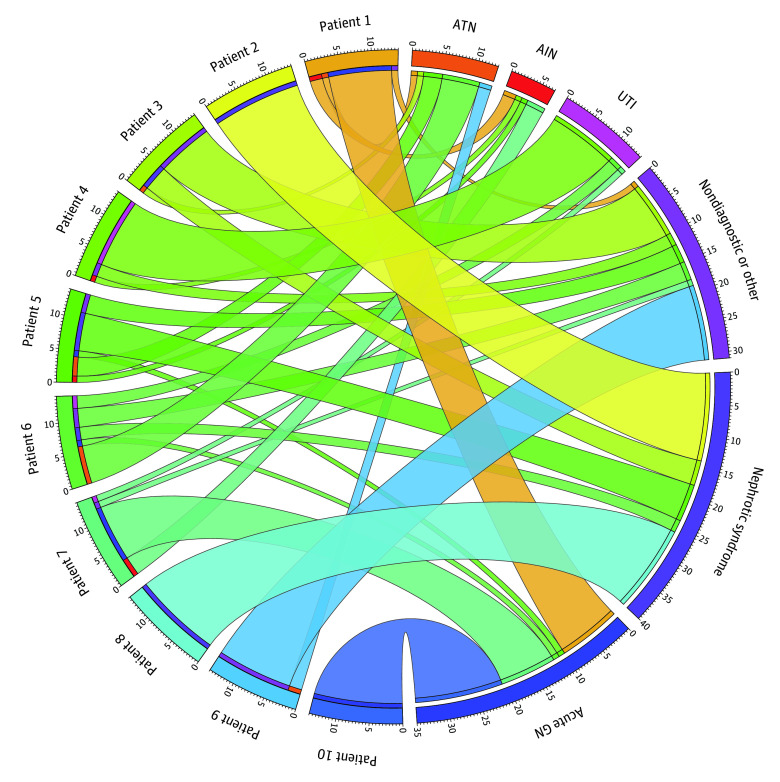
Main outcomes and measures: Interobserver reliability of urine sediment microscopy findings estimated by overall percent agreement and Fleiss κ coefficients. Secondary outcomes included concordance of diagnoses suspected by nephrologists with corresponding kidney biopsy results.
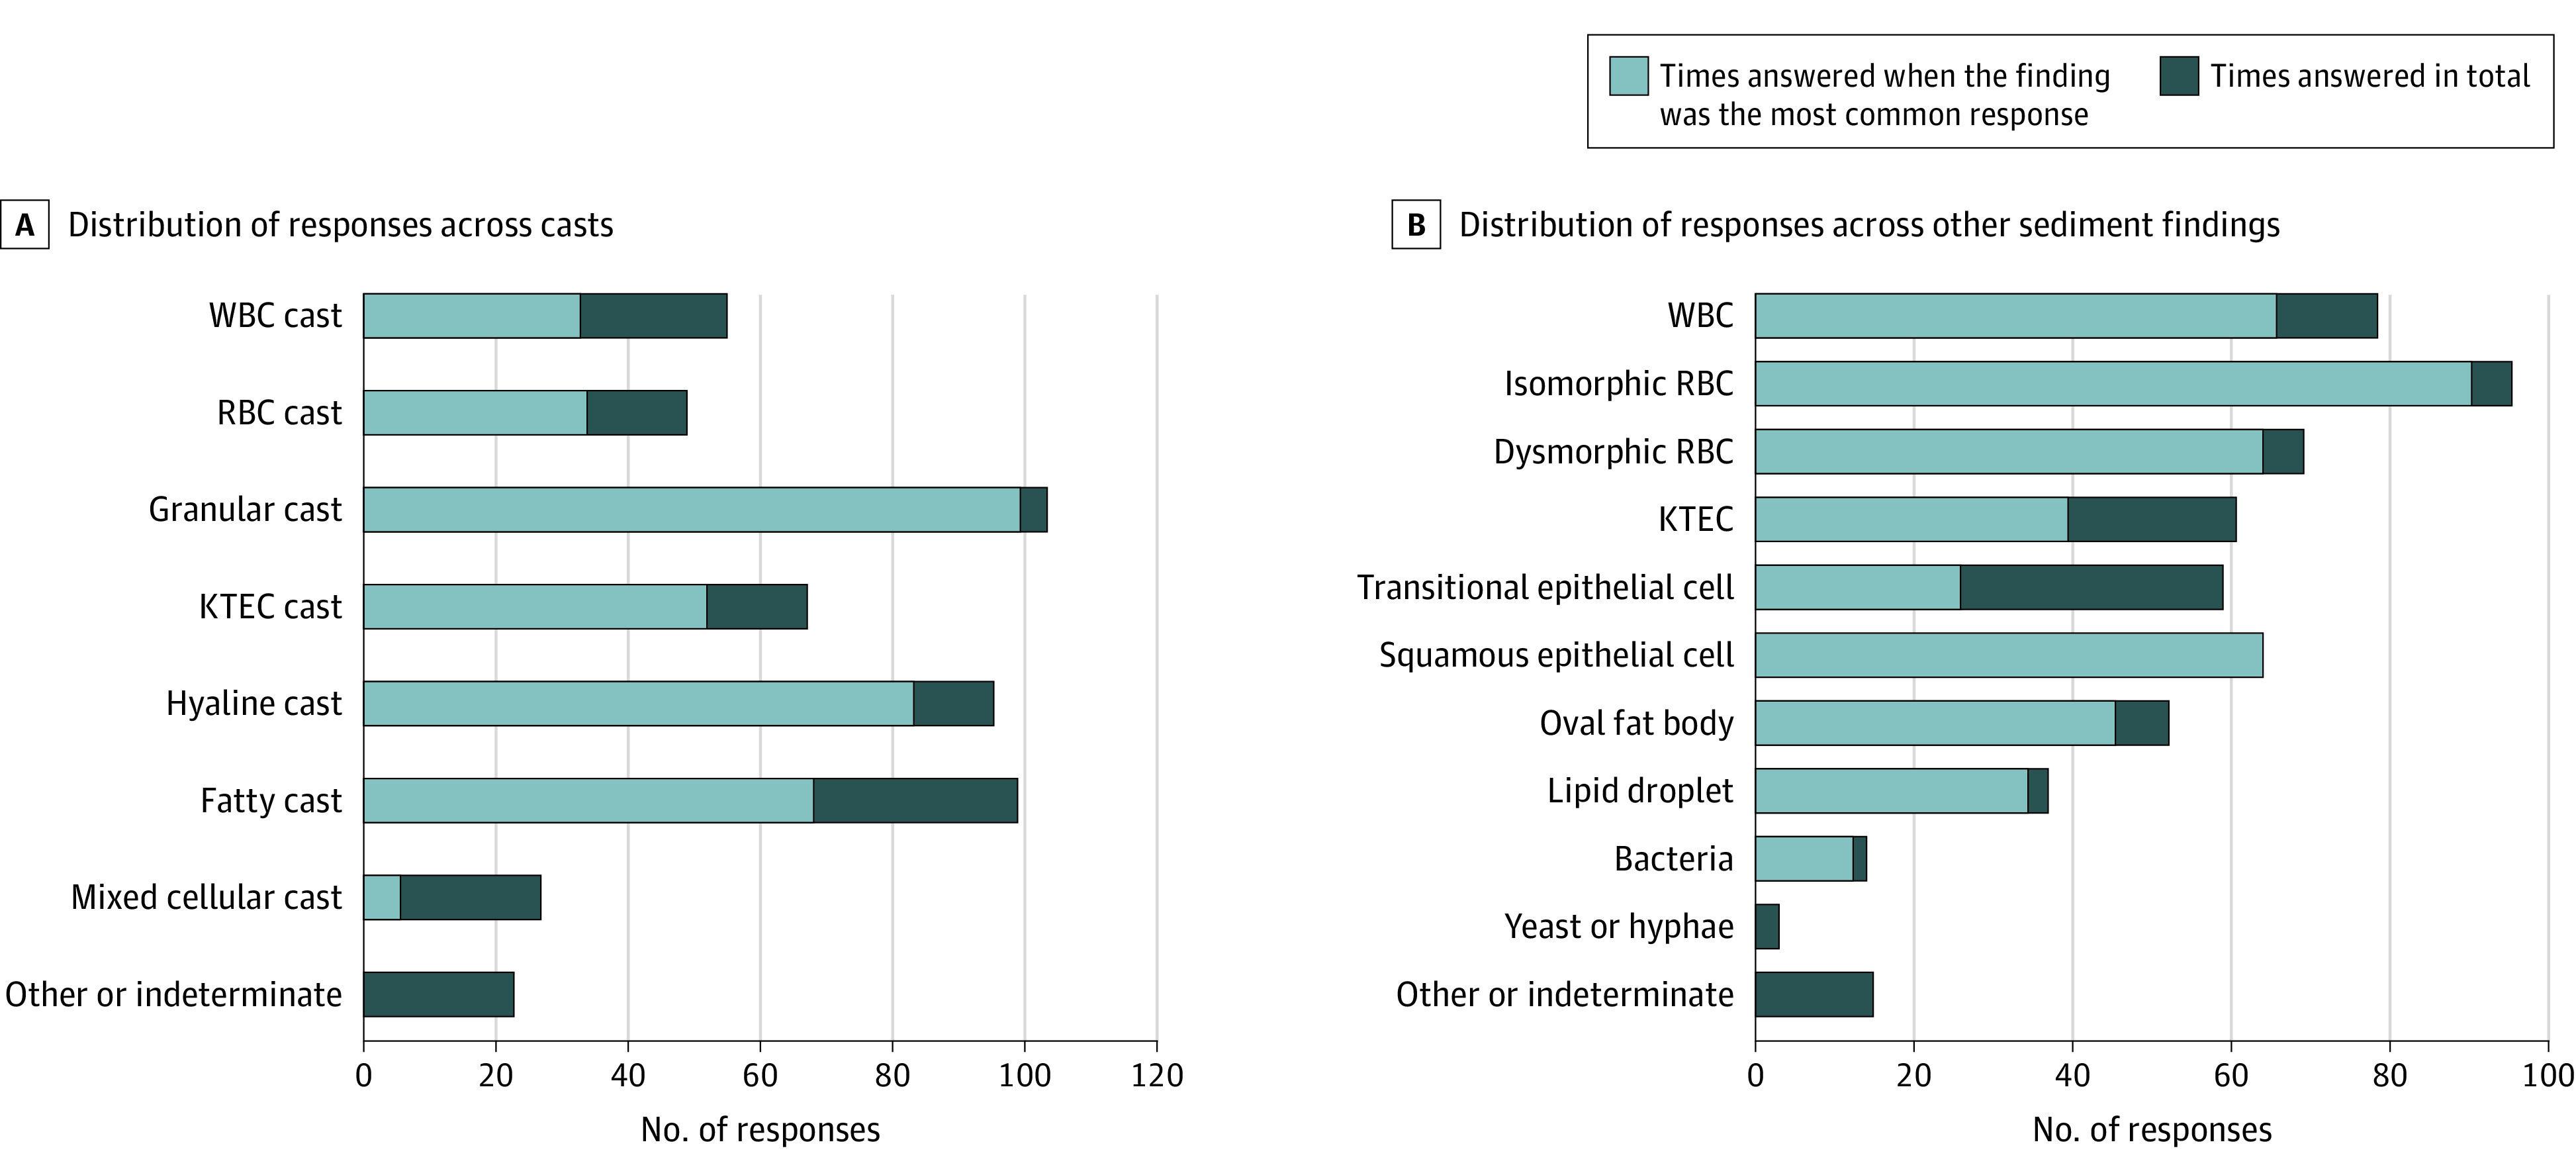
Results: In total, 10 surveys from 10 patients containing 76 study questions on individual features were sent to 21 nephrologists, 14 (67%) of whom completed them all. Their combined 1064 responses were analyzed. Overall percent agreement for casts was an estimated 59% (95% CI, 50%-69%), κ = 0.52 (95% CI, 0.42-0.62). For other sediment findings, overall percent agreement was an estimated 69% (95% CI, 61%-77%), κ = 0.65 (95% CI, 0.56-0.73). The κ estimates ranged from 0.13 (95% CI, 0.10-0.17) for mixed cellular casts to 0.90 (95% CI, 0.87-0.94) for squamous epithelial cells.
Conclusions and relevance: In this study, substantial variability occurred in the interpretation of urine sediment findings, even among expert nephrologists. Educational or technological innovations may help improve the urine sediment as a diagnostic tool.
Conflict of interest statement
Figures
Similar articles
-
Interobserver reliability of urine sediment interpretation.Clin J Am Soc Nephrol. 2009 Mar;4(3):567-71. doi: 10.2215/CJN.05331008. Epub 2009 Mar 4. Clin J Am Soc Nephrol. 2009. PMID: 19261816 Free PMC article.
-
Comparison and interpretation of urinalysis performed by a nephrologist versus a hospital-based clinical laboratory.Am J Kidney Dis. 2005 Nov;46(5):820-9. doi: 10.1053/j.ajkd.2005.07.039. Am J Kidney Dis. 2005. PMID: 16253721 Clinical Trial.
-
Urine Sediment Examination in the Diagnosis and Management of Kidney Disease: Core Curriculum 2019.Am J Kidney Dis. 2019 Feb;73(2):258-272. doi: 10.1053/j.ajkd.2018.07.012. Epub 2018 Sep 21. Am J Kidney Dis. 2019. PMID: 30249419 Review.
-
Comparison of the diagnostic performance of two automated urine sediment analyzers with manual phase-contrast microscopy.Clin Chem Lab Med. 2020 Jan 28;58(2):268-273. doi: 10.1515/cclm-2019-0919. Clin Chem Lab Med. 2020. PMID: 31605578
-
Advances in Urine Microscopy.Am J Kidney Dis. 2016 Jun;67(6):954-64. doi: 10.1053/j.ajkd.2015.11.011. Epub 2016 Jan 22. Am J Kidney Dis. 2016. PMID: 26806004 Review.
Cited by
-
Diagnostic Utility of Urine Microscopy in Kidney Diseases.Indian J Nephrol. 2024 May-Jun;34(3):213-221. doi: 10.25259/ijn_362_23. Epub 2024 May 28. Indian J Nephrol. 2024. PMID: 39114391 Free PMC article.
-
Comparison of IDEXX SediVue Dx® urine sediment analyzer to manual microscopy for detection of casts in canine urine.J Vet Intern Med. 2021 May;35(3):1439-1447. doi: 10.1111/jvim.16090. Epub 2021 Mar 24. J Vet Intern Med. 2021. PMID: 33760275 Free PMC article.
-
Concomitant Identification of Muddy Brown Granular Casts and Low Fractional Excretion of Urinary Sodium in AKI.Kidney360. 2022 Jan 19;3(4):627-635. doi: 10.34067/KID.0005692021. eCollection 2022 Apr 28. Kidney360. 2022. PMID: 35721603 Free PMC article.
-
Urine Sediment Exam Provides More Diagnostic Information in AKI than Novel Urinary Biomarkers: PRO.Kidney360. 2021 Sep 9;3(4):597-599. doi: 10.34067/KID.0004872021. eCollection 2022 Apr 28. Kidney360. 2021. PMID: 35721626 Free PMC article. No abstract available.
-
From past to present to future: Terlipressin and hepatorenal syndrome-acute kidney injury.Hepatology. 2024 Feb 14:10.1097/HEP.0000000000000790. doi: 10.1097/HEP.0000000000000790. Online ahead of print. Hepatology. 2024. PMID: 38353565
References
MeSH terms
LinkOut - more resources
Full Text Sources
Medical
