. 2020 Sep 15;205(6):1540-1553.
doi: 10.4049/jimmunol.2000039. Epub 2020 Aug 14.

IκBα Nuclear Export Enables 4-1BB-Induced cRel Activation and IL-2 Production to Promote CD8 T Cell Immunity

Affiliations

IκBα Nuclear Export Enables 4-1BB-Induced cRel Activation and IL-2 Production to Promote CD8 T Cell Immunity

Dominique N Lisiero et al. J Immunol. .

Abstract

Optimal CD8 T cell immunity is orchestrated by signaling events initiated by TCR recognition of peptide Ag in concert with signals from molecules such as CD28 and 4-1BB. The molecular mechanisms underlying the temporal and spatial signaling dynamics in CD8 T cells remain incompletely understood. In this study, we show that stimulation of naive CD8 T cells with agonistic CD3 and CD28 Abs, mimicking TCR and costimulatory signals, coordinately induces 4-1BB and cRel to enable elevated cytosolic cRel:IκBα complex formation and subsequent 4-1BB-induced IκBα degradation, sustained cRel activation, heightened IL-2 production and T cell expansion. NfkbiaNES/NES CD8 T cells harboring a mutated IκBα nuclear export sequence abnormally accumulate inactive cRel:IκBα complexes in the nucleus following stimulation with agonistic anti-CD3 and anti-CD28 Abs, rendering them resistant to 4-1BB induced signaling and a disrupted chain of events necessary for efficient T cell expansion. Consequently, CD8 T cells in NfkbiaNES/NES mice poorly expand during viral infection, and this can be overcome by exogenous IL-2 administration. Consistent with cell-based data, adoptive transfer experiments demonstrated that the antiviral CD8 T cell defect in NfkbiaNES/NES mice was cell intrinsic. Thus, these results reveal that IκBα, via its unique nuclear export function, enables, rather than inhibits 4-1BB-induced cRel activation and IL-2 production to facilitate optimal CD8 T cell immunity.


Conflict of interest statement

Conflicts of Interest

The authors declare no competing financial interests.

Figures
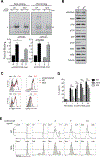
Figure 1.
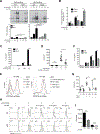
Figure 1.. IκBα NES is not necessary for efficient CD3+CD28 induced NF-κB activation and proliferation in CD8 T cells
(A) Naive NfkbiaWT/WT (WT) and NfkbiaNES/NES (NES) T cells were stimulated with 5 μg/mL each anti-CD3 and anti-CD28 antibodies and cell lysates were prepared. Supershift EMSA analysis with anti-cRel and anti-ReA antibodies was used to detect RelA and cRel complexes, respectively. Below, quantification of RelA (left, *) and cRel (right, **) binding, relative to unstimulated WT T cells and normalized to Oct-1 binding, is shown as fold change in comparison to unstimulated samples from three independent experiments with the mean +/− SEM with statistical significance at *p < 0.05 or as indicated. (B) Naive CD8 T cells were purified from WT and NfkbiaNES/NES spleens and total cell extracts were made. Immunoblot analysis of indicated NF-κB and IκB family members is shown with anti-tubulin as a loading control. (C) Naive WT and NfkbiaNES/NES CD8 T cells were stimulated with 5 µg/mL each of anti-CD3 and anti-CD28 antibodies for 24 hours. Cell were analyzed by flow cytometry with unstimulated CD8 T cells shown in shaded grey in each histogram. Median fluorescence intensity (MFI) of WT (black) and NfkbiaNES/NES (red) CD8 T cells is shown on top of each histogram. Data is representative of experiments performed independently at least three times. (D) WT, NfkbiaNES/NES, Rel−/− CD8 T cells stimulated for 48 hours with 5 µg/mL anti-CD3 and anti-CD28 antibodies. Supernatants were analyzed by ELISA for IL-2. Data is the mean +/− SEM of three technical replicates with statistical significance at *p < 0.05 and ** p < 0.01 and is representative of experiments performed independently at least three times. (E) Naive WT and NfkbiaNES/NES CD8 T cells were labeled with CFSE and stimulated with the indicated concentrations of anti-CD3 and anti-CD28 antibodies for 72 hours. Percentages of divided cells are shown. Data is representative of experiments performed independently at least five times.
Figure 2.
Figure 2.. IκBα nuclear export culminates in 4–1BB signaling defects in NfkbiaNES/NES CD8 T cells
(A) Naïve WT and NfkbiaNES/NES CD8 T cells were stimulated for 24 hours with 5 μg/mL anti-CD3 and anti-CD28 antibodies with or without 0.05 μg/mL anti-4–1BB antibody. Supershift analysis using anti-cRel and anti-RelA antibodies was performed to detect RelA (left, *) and cRel (right, **) complexes, respectively. Below, quantification of indicated complexes is shown as fold change in comparison to unstimulated samples and normalized to Oct-1 binding. Data plotted is the mean +/− SEM and includes 3 independent experiments with statistical significance at *p < 0.05. (B) Absolute RelA and cRel binding levels in Figure 1A & 2A relative to the absolute RelA binding level at 0 hrs (Figure 2A) and normalized to Oct-1 binding are shown with SEM and statistical significance at *p < 0.05. (C) Naïve WT and NfkbiaNES/NES CD8 T cells were stimulated for 48 hours with 5 μg/mL anti-CD3 and anti-CD28 antibodies with or without increasing concentrations of anti-4–1BB antibody or normal rat IgG (IgG) control. Supernatants were analyzed by ELISA for IL-2. Data is the mean +/− SEM of three technical replicates and *p < 0.05 and representative of three independent experiments. (D) Samples stimulated as in (C) were analyzed by flow cytometry for CD25 expression. Each data point represents one independent biological replicate with the SEM and *p < 0.05. (E) Naïve WT, NfkbiaNES/NES, and Rel−/− CD8 T cells were stimulated as in (C) for 48 hours and analyzed by flow cytometry for phosphorylated STAT5. (F) Naïve WT and NfkbiaNES/NES CD8 T cells were unstimulated or stimulated with 5 μg/mL each of anti-CD3 and anti-CD28 antibodies with control Rat IgG, anti-OX40 antibody (5 μg/mL), or anti-CD27 antibody (5 ug/mL) crosslinked by anti-rat and anti-hamster Ig for 48 hours. Supernatants were analyzed by ELISA for IL-2. Data is the mean +/− SEM of three technical replicates and *p < 0.05 and representative of three independent experiments. (G) Samples stimulated as in (F) analyzed by flow cytometry for CD25 expression. Each data point represents one independent biological replicate and SEM is indicated with *p<0.05. (H) Naive WT and NfkbiaNES/NES CD8 T cells isolated from the spleen were labeled with CFSE and stimulated with 5 µg/mL of anti-CD3 and anti-CD28 antibodies along with the indicated concentrations of anti-4–1BB for 72 hours. Percentages of undivided cells (right) and divided cells (left) are shown. Data is representative of experiments performed independently at least 3 times. (I) Naïve WT and NfkbiaNES/NES CD8 T cells were stimulated as in Supplemental Figure 2F. Absolute live cells numbers were quantified by flow cytometry. Data is representative of experiments performed independently at least 3 times.
Figure 3.
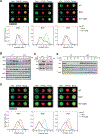
Figure 3.. IκBα NES is necessary for CD3+CD28 induced cytoplasmic localization of IκBα:cRel complexes to enable efficient 4–1BB signaling
(A) Naive WT and NfkbiaNES/NES CD8 T cells were fixed, permeabilized, and stained with anti-IκBα, RelA or cRel antibodies and the DRAQ5 nuclear dye. WT cells were treated with 20 ng/ml of Leptomycin B for 45 minutes as a control. Single cell image analysis by ImageStream flow cytometry. Representative images from each group are shown at an equivalent magnification (above) and the similarity score for each antibody staining is plotted. Data plotted includes 3 independent experiments (see Methods). (B) Naive WT and NfkbiaNES/NES CD8 T cells were stimulated for the indicated times with 5 μg/mL each anti-CD3 and anti-CD28. Immunoblot analysis of cRel, RelA, p50, IκBα, and tubulin is shown. Data is representative of 3 independent experiments. (C) Cell extracts from naive WT CD8 T cells and those unstimulated or stimulated as in (B) for 24 hours were immunoprecipitated with an antibody specific for IκBα. Immunoblot analysis of cRel, RelA, and IκBα is shown. (D) Naive WT and NfkbiaNES/NES CD8 T cells were stimulated for 24 hours with 5 μg/mL each anti-CD3 and anti-CD28 and stained and analyzed as in (A). Representative images for each antibody staining are shown at the equivalent magnification as in (A). Note the larger cell size of the stimulated cells relative to naïve cells in (A). (E) Naive WT and NfkbiaNES/NES CD8 T cells were stimulated for 24 hours with anti-CD3 and anti-CD28 antibodies as in (A). Following stimulation, cells were pre-treated with 20 ug/mL cycloheximide (CHX) for 30 minutes and then stimulated with 0.05 μg/mL anti-4–1BB antibody for the indicated times. Immunoblot analysis of IκBα, IκBβ, and tubulin is shown.
Figure 4.
Figure 4.. IκBα nuclear export is required for inducing a 4–1BB-mediated NF-κB transcriptional program in CD8 T cells
(A) The RNA sequencing study design is shown with naïve Nfkbia+/+ and NfkbiaNES/NES CD8 T cells stimulated with 5 μg/mL each of anti-CD3 and anti-CD28 antibodies for 12 hours without (12hr-) or with (12 hr+) 0.05 μg/mL anti-4–1BB antibody. (B) MA plots showing differentially expressed genes (up and down) between “12 hr+” vs. “12 hr-” WT CD8 T cells (left, absolute Log2 fold change > 1 and FDR < 0.01) and between WT “12 hr+” versus NfkbiaNES/NES “12 hr+” (right, absolute Log2 fold change > 0.5 and FDR < 0.05). (C) Venn diagram illustrating the number of genes regulated by 4–1BB and by NfkbiaNES/NES in CD8 T cells. (D) Bar graph showing ranked fold enrichment of enriched KEGG pathways (p-value < 0.05) in “NES dependent” genes. (E) Comparison of expression of the top 20 WT 12 hr+ vs. 12 hr- genes. Dots and crosses represent Log2 fold change comparing WT “12 hr+” vs. WT “12 hr-” and NfkbiaNES/NES “12 hr+” vs. WT “12 hr-”, respectively with red and grey colors indicating “NES dependent” and “NES independent,” respectively. (F) Bar graph showing the odds ratios for the occurrence of NF-κB dimer binding motifs (p65:p50, cRel:p50, cRel:cRel) in the promoter regions (−1kb to 300bp) of “NES dependent” genes. P-values from the same Fisher’s exact test are shown.
Figure 5.
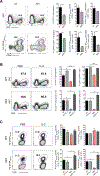
Figure 5.. NfkbiaNES/NES mice have a primary CD8 T cell expansion defect following LCMV infection which can be restored by exogenous IL-2 administration
(A) WT and NfkbiaNES/NES mice were infected with LCMV Armstrong. Eight days post-infection, splenocytes from each group were assessed by flow cytometry for CD8 T cells staining positive for CD44 and H2-Db specific NP396–404 tetramer and staining positive for IFN-γ following restimulation with NP396–404 peptide. (B) WT and NfkbiaNES/NES mice were infected with LCMV Armstrong. Mice were injected with recombinant human IL-2 (10,000 IU) or PBS twice a day for 6 days following infection. Eight days post-infection, splenocytes were analyzed by flow cytometry and percentages and absolute numbers of cells staining positive for CD8 and CD44 are shown. (C) WT and NfkbiaNES/NES mice from (B) were also analyzed by flow cytometry with percentages and absolute numbers staining positive for GP33–41 and NP396–404 tetramers are shown. Data shown in (A)–(C) are the mean +/− SEM of five mice per group and representative of two independent experiments with *p<0.05.
Figure 6.
Figure 6.. The antiviral defect in NfkbiaNES/NES mice is CD8 T-cell intrinsic
(A) Lethally irradiated Ly5.1 host mice were reconstituted with a mix of bone marrow to generate control chimeras, CC (Ly5.1+ host strain cells and Ly5.2+ NfkbiaWT/WT) or experimental chimeras, EC (Ly5.1+ host strain cells and Ly5.2+ NfkbiaNES/NES) (see Supplemental Figure 3A for schematic) and infected with LCMV Armstrong. Eight days post-infection, splenocytes from control and experimental chimeras were assessed by flow cytometry for Ly5.2+ CD8 T cells staining positive for CD44, CD62L, NP396–404 tetramer, and KLRG1. Data are the mean +/− SEM and representative of 3–4 mice per group with statistical significance at *p<0.05 and **p < 0.01. (B) Thy1.1 host mice were adoptively transferred with either P14 transgenic Thy1.2+ NfkbiaWT/WT (Ly5.2+) or P14 transgenic Thy1.2+ NfkbiaNES/NES (Ly5.2+) CD8 T cells. Mice were infected with LCMV Armstrong and analyzed 8 days post-infection for P14 transgenic T cell expansion. Data are the mean +/− SEM and representative of 6 mice per group with statistical significance at **p < 0.01. (C) Thy1.1 host mice were adoptively transferred with a 1:1 mix of P14 transgenic Thy1.2+ Nfkbia+/+ (Ly5.1+) and Thy1.2+ NfkbiaNES/NES (Ly5.2+) cells. Twenty-four hours later, mice were infected with LCMV Armstrong and analyzed 8 days post-infection for P14 transgenic T cell expansion. Data are the mean +/− SEM and representative of 7 mice per group with statistical significance at ***p < 0.001.

Similar articles

Cited by

References

    1. Duttagupta PA, Boesteanu AC, and Katsikis PD. 2009. Costimulation signals for memory CD8+ T cells during viral infections. Crit Rev Immunol 29: 469–486. - PMC - PubMed
    1. Croft M 2009. The role of TNF superfamily members in T-cell function and diseases. Nat Rev Immunol 9: 271–285. - PMC - PubMed
    1. Jameson SC, and Masopust D. 2009. Diversity in T cell memory: an embarrassment of riches. Immunity 31: 859–871. - PMC - PubMed
    1. Chen L, and Flies DB. 2013. Molecular mechanisms of T cell co-stimulation and co-inhibition. Nat Rev Immunol 13: 227–242. - PMC - PubMed
    1. Borowski AB, Boesteanu AC, Mueller YM, Carafides C, Topham DJ, Altman JD, Jennings SR, and Katsikis PD. 2007. Memory CD8+ T cells require CD28 costimulation. J Immunol 179: 6494–6503. - PubMed

Publication types

MeSH terms