. 2020 Oct 19;88(11):e00172-20.
doi: 10.1128/IAI.00172-20. Print 2020 Oct 19.

Coxiella burnetii-Infected NK Cells Release Infectious Bacteria by Degranulation

Affiliations

Coxiella burnetii-Infected NK Cells Release Infectious Bacteria by Degranulation

Svea Matthiesen et al. Infect Immun. .

Abstract

Natural killer (NK) cells are critically involved in the early immune response against various intracellular pathogens, including Coxiella burnetii and Chlamydia psittaciChlamydia-infected NK cells functionally mature, induce cellular immunity, and protect themselves by killing the bacteria in secreted granules. Here, we report that infected NK cells do not allow intracellular multiday growth of Coxiella, as is usually observed in other host cell types. C. burnetii-infected NK cells display maturation and gamma interferon (IFN-γ) secretion, as well as the release of Coxiella-containing lytic granules. Thus, NK cells possess a potent program to restrain and expel different types of invading bacteria via degranulation. Strikingly, though, in contrast to Chlamydia, expulsed Coxiella organisms largely retain their infectivity and, hence, escape the cell-autonomous self-defense mechanism in NK cells.

Keywords: Chlamydia psittaci; Coxiella burnetii; NK cells; cell-autonomous immunity.


Figures

FIG 1
FIG 1
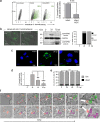
Uptake and functional activation of KY-2 cells during C. burnetii infection. (a) Flow cytometric analysis of infected KY-2 cells (72 hpi; MOI, 10) in the absence or presence of MDC (200 μM). To quantify C. burnetii-positive NK cells (green), the negative cell population (black) was identified and gated via corresponding noninfected controls and then subtracted from the total cell population (left). The corresponding plot (right) shows the amount of positive KY-2 cells (***, P < 0.001 versus control [infected without treatment]; n = 3; mean ± SD). (b) To identify intra- and extracellular bacteria at 8 hpi, infected NK cells were permeabilized or not and then exposed to Coxiella-specific antiserum. Afterwards, cells were analyzed by immunofluorescence microscopy (left). The Western blot (middle) of infected KY-2 cells (0 to 72 hpi; MOI, 10) shows coxHSP60 in cell lysates (intracellular) and culture supernatants (extracellular). GAPDH served as a loading control. coxHSP60 signals were determined by densitometric analysis (right). The signal of total coxHSP60 at 24 hpi was set to 100. (c) KY-2 cells were infected or not with Coxiella (0 to 72 hpi; MOI, 10) and stained for Coxiella (green) and DNA (4′,6-diamidino-2-phenylindole [DAPI]; blue). (d) Flow cytometric analysis of C. burnetii infection in KY-2 cells (0 to 72 hpi; MOI, 10). The plot displays the relative amount of infected cells. The maximum mean value at 24 hpi was set to 1 (**, P < 0.01, and ***, P < 0.001, versus 24 hpi; n = 3; mean ± SD). (e) Analysis of necrotic/apoptotic KY-2 cells during Coxiella infection (0 to 72 hpi; MOI, 10) was performed via trypan blue staining (not significant [n.s.] versus 0 hpi; n = 3; mean ± SD). (f) Long-term time-lapse recording of Coxiella release from infected NK cells. A total of 1 × 105 NK cells were infected with C. burnetii (tdTomato; MOI, 30; washed 3 hpi), and LCI was started at 24 hpi. Bacterial movement was tracked at 37°C. Trajectories were determined from the image series. The timestamp is relative to the start of the respective image series and thus starts at 0 min. The upper and lower rows correspond to starting time points at 24 hpi and 26 hpi, respectively. The differently colored lines (green and magenta) show the individual Coxiella trajectories over periods of 510 and 800 min. The corresponding time-lapse movies are included in the supplemental material (Movies S1 and S2).
FIG 2
FIG 2
Short-interval time-lapse image series of C. burnetii-release from an infected NK cell. A total of 1 × 105 NK cells were infected with C. burnetii (tdTomato; MOI, 30; washed 3 hpi) and overlaid with 0.6% low-melting-point-agarose-containing KY-2 cell culture medium at 20 hpi. The time-lapse image series shows a period of about 21.5 min, starting at about 31.5 hpi. Bacterial movement during release was tracked at 37°C, and the maximum z-projection of the fluorescence channel (C. burnetii, red) was merged with a single representative plane of the bright-field channel. Trajectories are shown as green lines. The first row displays selected bright-field images of the LCI analysis. The second row shows the overlay of the selected bright-field images with maximum z-projection of red fluorescent bacteria. The third and fourth rows depict corresponding detail views of the bacterial exit process as bright-field images and as overlays with red fluorescent bacteria. The time-lapse movie is included in the supplemental material (Movie S3).
FIG 3
FIG 3
Activation of KY-2 cells during C. burnetii infection. (a) Flow cytometric analysis of NK cell degranulation via staining of surface CD107a/LAMP1 (left) on noninfected and C. burnetii-infected KY-2 cells (24 hpi; MOI, 10). KY-2 cell endocytosis was inhibited 12 hpi by MDC to stabilize surface-expressed CD107a/LAMP1. Cells were first stained for surface CD107a/LAMP1 and then fixed. After mild permeabilization, pretreated cells were stained for intracellular bacteria. The corresponding histogram plot (right) shows the relative increase of the surface CD107a/LAMP1 (noninfected controls were set to 1 (*, P < 0.05 versus control [noninfected]; n = 3; mean ± SD). (b) Secretion of Grzm B (left) and IFN-γ (right) of infected KY-2 cells (0 to 72 hpi; MOI, 10) measured by ELISA (**, P < 0.01, and ****, P < 0.0001, versus noninfected control; n = 3; mean ± SD). (c) Analysis of PKCϴ phosphoactivation during KY-2 cell infection. KY-2 cells were infected or not with C. burnetii (MOI, 10) for 72 h and analyzed by Western blots probed for P-PKCϴ, PKCϴ, and coxHSP60 (top). GAPDH served as a loading control. After densitometric analysis (bottom), the P-PKCϴ/PKCϴ ratio was plotted (gray histogram) and compared to the control of noninfected KY-2 cells (black histogram; controls were set to 1; *, P < 0.05, versus noninfected control; n = 3; ± SD). (d) Western blot analysis of coxHSP60 in infected KY-2 cells (MOI 10) (top) and culture supernatants (bottom) in the absence or presence of PKCϴ inhibitor sotrastaurin (250 nM) 24 hpi and 72 hpi. GAPDH and Ponceau-S staining served as loading controls for cell lysates and culture supernatants, respectively.
FIG 4
FIG 4
Characterization of intracellular C. burnetii in infected KY-2 cells. (a) TEM of noninfected (control) and C. burnetii-infected (24 hpi and 72 hpi; MOI, 10) KY-2 cells. Arrowheads indicate cell surface membrane-associated Coxiella structures. (b) TEM of C. burnetii-infected (24 hpi; MOI, 10) KY-2 cells. Arrowheads indicate electron-dense intracellular Coxiella structures associated with secretory granules of KY-2 cells. (c) Immunofluorescence analysis of perforin (green) and C. burnetii (red) in infected (24 hpi; MOI, 10) and noninfected KY-2 cells. DNA was stained via DAPI (blue).
FIG 5
FIG 5
Characterization of extracellular C. burnetii and C. psittaci released by infected KY-2 cells. (a) The left image depicts an immunofluorescence analysis showing colocalization of perforin (green) and KY-2 cell-released C. burnetii (red) 24 hpi (MOI, 10). A TEM analysis of NK cell-released bacterial structures (72 hpi; MOI, 10) is shown in the middle image. Black stars indicate intact C. burnetii, whereas black diamonds mark largely deformed, aberrant bacterial structures. The TEM analysis of purified C. burnetii stocks from infected L929 cells containing LCVs and SCVs of C. burnetii is shown in the right image. (b) The first image depicts a TEM analysis of NK cell-released chlamydial structures. The inset highlights an immunofluorescence analysis showing colocalization of perforin (green) and KY-2-released C. psittaci (red) at 24 hpi (MOI, 10). A TEM analysis of an infectious C. psittaci stock is shown in the second image from the left. The two images on the right show enlarged TEM pictures of Chlamydia, either released from NK cells by degranulation or harvested from an infectious stock culture.
FIG 6
FIG 6
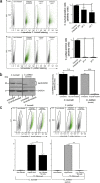
C. burnetii survives the cellular defense (granule uptake and release) of infected NK cells. (a) C. burnetii and C. psittaci were preincubated in citrate buffer at pH 4 and 5 or in Tris buffer at pH 7 (control) for 18 h at 4°C. After infection (MOI, 10) of suitable reporter cells (L929 and BGM; 72 hpi), infectivity was measured by flow cytometry (top). Bacterium-positive cells (green) were identified and gated (left) as described in the legend to Fig. 1. The corresponding histogram plots (right) show the number of positive cells (controls were set to 1 [infected without preincubation]; *, P < 0.05, **, P < 0.01, and ***, P < 0.001, versus control; n = 3; mean ± SD). (b) Western blot analysis of cell infection after treatment of purified Chlamydia or Coxiella with Grzm B. Both pathogens were incubated with Grzm B or left untreated. The bacteria were then washed and used for the infection of reporter cells (L929 for Coxiella and BGM for Chlamydia; 72 hpi; MOI, 30). Bacterial HSP60 (bactHSP60) signal intensities were measured by densitometric analysis (left). GAPDH served as a loading control. The obtained results of three independent experiments are depicted as a histogram plot (right) (signals of untreated samples were set to 1; n.s., ***, P < 0.001, versus untreated samples; n = 3; mean ± SD). (c) Flow cytometry of the infectivity of culture supernatants (sup.) from KY-2 cells. KY-2 cells were infected with bacteria (Chlamydia or Coxiella; MOI, 10 [10 IFU/cell]) or not for 72 h. GEs were determined by qPCR. To compare the infectivity of original stocks and NK cell-released bacteria, equal amounts of GEs (Coxiella and Chlamydia infections, 70 GEs/cell) were used in parallel experiments for reporter cell infection (L929 and BGM). Bacterium-positive cells (green) were identified and gated (upper panel) as described in the legend to Fig. 1. The corresponding histogram plot (bottom) shows the relative number of infected reporter cells (controls were set to 1 [original stocks]; *, P < 0.05, and ***, P < 0.001, versus controls; n = 3; mean ± SD).
FIG 7
FIG 7
Growth/replication of Coxiella released from KY-2 cells. (a) Flow cytometry of the Coxiella growth/replication in L929 cells infected with bacteria expulsed by KY-2 (top). NK cells were infected with C. burnetii (MOI, 10 [10 IFU/cell]) or not for 72 h. Bacteria from corresponding culture supernatants were centrifuged and washed. GEs of the pellet fractions were determined by qPCR, and 70 GEs/cell were used for L929 cell infection and analyzed for different time points (control, 24 to 72 h). Bacterium-positive cells (green) were identified and gated (top) as described in the legend to Fig. 1. The corresponding histogram plots (bottom) show the relative number of infected reporter cells (control, 24 to 72 hpi) (values obtained for 72 hpi were set to 1; **, P < 0.01, and ***, P < 0.001, versus controls; n = 3; mean ± SD). (b) Immunofluorescence analysis of C. burnetii (green) in infected and reinfected (70 GEs/cell) L929 cells (72 hpi). DNA was stained via DAPI (blue). (c) Successive reinfection of L929 cells. Centrifuged/washed bacteria expulsed by infected KY-2 cells were used for an L929 cell reinfection assay (1. reinfection, 70 GEs/cell). After 72 h, one-half of the infected cells was examined for infection by flow cytometry. The other half was homogenized to harvest Coxiella for a second reinfection round in L929 cells (2. reinfection). As with the 1. reinfections, flow cytometry was performed after 72 hpi.
FIG 8
FIG 8
C. burnetii infection of primary NK cells. (a) Western blot of infected primary NK cells (0 to 72 hpi; MOI, 10) showing coxHSP60 in cell lysates (intracellular) and culture supernatants (extracellular) (left). GAPDH served as a loading control. coxHSP60 signals were determined by densitometric analysis (right). The signal of total coxHSP60 at 24 hpi was set to 100. (b) Flow cytometric analysis of C. burnetii infection in KY-2 cells (0 to 72 hpi; MOI, 10). The depicted plot displays the relative amount of infected cells. The maximum value at 24 hpi was set to 1 (**, P < 0.01, and ***, P < 0.001, versus 24 hpi; n = 3; ± SD). (c) Necrotic/apoptotic KY-2 cells during Coxiella infection (0 to 72 hpi; MOI, 10) were identified by trypan blue staining (n.s. versus 0 hpi; n = 3; mean ± SD). (d) Western blot and protein staining of coxHSP60 in infected primary NK cells (MOI, 10) as well as culture supernatants in the presence of sotrastaurin (72 hpi). Ponceau-S staining served as a loading control. (e) Immunofluorescence microscopy shows colocalization of perforin (green) and C. burnetii (red) in infected primary NK cells (24 hpi; MOI 20) (left) and for NK cell-released C. burnetii (12 hpi, MOI 20) (right). DNA was stained with DAPI (blue). (f) Flow cytometry of the infectivity of culture supernatants from primary NK cells. Primary NK cells were infected with bacteria (Chlamydia or Coxiella; MOI, 10) or not for 72 h. GEs were determined by qPCR. Equal amounts of GEs (Coxiella and Chlamydia infections, 70 GEs/cell) were used in parallel experiments for reporter cell infection. The corresponding histogram plot shows the relative number of infected reporter cells (controls were set to 1 [original stocks]; **, P < 0.01, and ***, P < 0.001, versus controls; n = 3; mean ± SD).
FIG 9
FIG 9
Growth/replication of Coxiella released from primary NK cells. (a) Flow cytometry of the Coxiella growth/replication in L929 cells infected with bacteria expulsed by primary NK cells (top). NK cells were infected with C. burnetii (MOI, 10 [10 IFU/cell]) or not for 72 h. GEs were determined by qPCR, and 70 GEs/cell were used for L929 cell infection and analyzed for different periods (control, 24 to 72 h). Bacterium-positive cells (green) were identified and gated (top) as described in the legend to Fig. 1. The corresponding histogram plots (bottom) show the relative number of infected reporter cells (control, 24 to 72 hpi) (values obtained for 72 hpi were set to 1; **, P < 0.01, and ***, P < 0.001, versus controls; n = 3; mean ± SD). (b) Immunofluorescence analysis of C. burnetii (green) in infected and reinfected (70 GEs/cell) L929 cells (72 hpi). DNA was stained via DAPI (blue). c) Successive reinfection of L929 cells. Centrifuged/washed bacteria expulsed by infected primary NK cells were used for an L929 reinfection assay (1. Reinfection, 70 GEs/cell). After 72 h, one-half of the infected cells was examined for infection by flow cytometry. The other half was homogenized to harvest Coxiella for a second reinfection round in L929 cells (2. reinfection). As with the 1. reinfections, flow cytometry was performed after 72 hpi.
FIG 10
FIG 10
Working model of bacterial escape from cellular self-defense of C. burnetii-infected NK cells. The depicted model shows the transient C. burnetii-infection of NK cells triggering activation, cytokine secretion, bacterial granule fusion, and release of infectious Coxiella.

Similar articles

Cited by

References

    1. Topham NJ, Hewitt EW. 2009. Natural killer cell cytotoxicity: how do they pull the trigger? Immunology 128:7–15. doi:10.1111/j.1365-2567.2009.03123.x. - DOI - PMC - PubMed
    1. Jiao L, Gao X, Joyee AG, Zhao L, Qiu H, Yang M, Fan Y, Wang S, Yang X. 2011. NK cells promote type 1 T cell immunity through modulating the function of dendritic cells during intracellular bacterial infection. J Immunol 187:401–411. doi:10.4049/jimmunol.1002519. - DOI - PubMed
    1. Li J, Dong X, Zhao L, Wang X, Wang Y, Yang X, Wang H, Zhao W. 2016. Natural killer cells regulate Th1/Treg and Th17/Treg balance in chlamydial lung infection. J Cell Mol Med 20:1339–1351. doi:10.1111/jcmm.12821. - DOI - PMC - PubMed
    1. Tseng CT, Rank RG. 1998. Role of NK cells in early host response to chlamydial genital infection. Infect Immun 66:5867–5875. doi:10.1128/IAI.66.12.5867-5875.1998. - DOI - PMC - PubMed
    1. Radomski N, Franzke K, Matthiesen S, Karger A, Knittler MR. 2019. NK cell-mediated processing of Chlamydia psittaci drives potent anti-bacterial Th1 immunity. Sci Rep 9:4799. doi:10.1038/s41598-019-41264-4. - DOI - PMC - PubMed

Publication types

LinkOut - more resources