An autophagy-related long non-coding RNA prognostic signature accurately predicts survival outcomes in bladder urothelial carcinoma patients
- PMID: 32805727
- PMCID: PMC7467376
- DOI: 10.18632/aging.103718
An autophagy-related long non-coding RNA prognostic signature accurately predicts survival outcomes in bladder urothelial carcinoma patients
Abstract
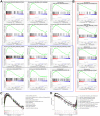
In this study, we analyzed the prediction accuracy of an autophagy-related long non-coding RNA (lncRNA) prognostic signature using bladder urothelial carcinoma (BLCA) patient data from The Cancer Genome Atlas (TCGA) database. Univariate and multivariate Cox regression analyses showed significant correlations between five autophagy-related lncRNAs, LINC02178, AC108449.2, Z83843.1, FAM13A-AS1 and USP30-AS1, and overall survival (OS) among BCLA patients. The risk scores based on the autophagy-related lncRNA prognostic signature accurately distinguished high- and low-risk BCLA patients that were stratified according to age; gender; grade; and AJCC, T, and N stages. The autophagy-related lncRNA signature was an independent prognostic predictor with an AUC value of 0.710. The clinical nomogram with the autophagy-related lncRNA prognostic signature showed a high concordance index of 0.73 and accurately predicted 1-, 3-, and 5-year survival times among BCLA patients in the high- and low-risk groups. The lncRNA-mRNA co-expression network contained 77 lncRNA-mRNA links among 5 lncRNAs and 49 related mRNAs. Gene set enrichment analysis showed that cancer- and autophagy-related pathways were significantly enriched in the high-risk group, and immunoregulatory pathways were enriched in the low-risk group. These findings demonstrate that an autophagy-related lncRNA signature accurately predicts the prognosis of BCLA patients.
Keywords: autophagy; bladder urothelial carcinoma; long non-coding RNA; prognostic signature; the cancer genome atlas.
Conflict of interest statement
Figures


Similar articles
-
Identification of a ten-long noncoding RNA signature for predicting the survival and immune status of patients with bladder urothelial carcinoma based on the GEO database: a superior machine learning model.Aging (Albany NY). 2021 Feb 17;13(5):6957-6981. doi: 10.18632/aging.202553. Epub 2021 Feb 17. Aging (Albany NY). 2021. PMID: 33621953 Free PMC article.
-
Identification of an immune-related long non-coding RNA signature and nomogram as prognostic target for muscle-invasive bladder cancer.Aging (Albany NY). 2020 Jun 24;12(12):12051-12073. doi: 10.18632/aging.103369. Epub 2020 Jun 24. Aging (Albany NY). 2020. PMID: 32579540 Free PMC article.
-
Identification of cuproptosis-related long non-coding RNA and construction of a novel prognostic signature for bladder cancer: An observational study.Medicine (Baltimore). 2024 May 3;103(18):e38005. doi: 10.1097/MD.0000000000038005. Medicine (Baltimore). 2024. PMID: 38701267 Free PMC article.
-
A potential prognostic lncRNA signature for predicting survival in patients with bladder urothelial carcinoma.Oncotarget. 2017 Feb 7;8(6):10485-10497. doi: 10.18632/oncotarget.14441. Oncotarget. 2017. PMID: 28060759 Free PMC article.
-
Non-coding RNA and autophagy: Finding novel ways to improve the diagnostic management of bladder cancer.Front Genet. 2023 Jan 4;13:1051762. doi: 10.3389/fgene.2022.1051762. eCollection 2022. Front Genet. 2023. PMID: 36685879 Free PMC article. Review.
Cited by
-
Identification of Novel Key Genes and Pathways in Multiple Sclerosis Based on Weighted Gene Coexpression Network Analysis and Long Noncoding RNA-Associated Competing Endogenous RNA Network.Oxid Med Cell Longev. 2022 Mar 2;2022:9328160. doi: 10.1155/2022/9328160. eCollection 2022. Oxid Med Cell Longev. 2022. PMID: 35281467 Free PMC article.
-
LncRNA FAM13A-AS1 Regulates Proliferation and Apoptosis of Cervical Cancer Cells by Targeting miRNA-205-3p/DDI2 Axis.J Oncol. 2022 Jun 23;2022:8411919. doi: 10.1155/2022/8411919. eCollection 2022. J Oncol. 2022. PMID: 35783157 Free PMC article.
-
Effect of Aberrant Long Noncoding RNA on the Prognosis of Clear Cell Renal Cell Carcinoma.Comput Math Methods Med. 2021 Sep 3;2021:6533049. doi: 10.1155/2021/6533049. eCollection 2021. Comput Math Methods Med. 2021. PMID: 34512796 Free PMC article.
-
Identification of a Nomogram from Ferroptosis-Related Long Noncoding RNAs Signature to Analyze Overall Survival in Patients with Bladder Cancer.J Oncol. 2021 Aug 26;2021:8533464. doi: 10.1155/2021/8533464. eCollection 2021. J Oncol. 2021. PMID: 34484338 Free PMC article.
-
A Glycolysis-Based Long Non-coding RNA Signature Accurately Predicts Prognosis in Renal Carcinoma Patients.Front Genet. 2021 Apr 1;12:638980. doi: 10.3389/fgene.2021.638980. eCollection 2021. Front Genet. 2021. PMID: 33868376 Free PMC article.
References
MeSH terms
Substances
LinkOut - more resources
Full Text Sources
Other Literature Sources
Medical

