. 2020 Aug 12;8(1):133.
doi: 10.1186/s40478-020-00993-8.

Prominent microglial inclusions in transgenic mouse models of α-synucleinopathy that are distinct from neuronal lesions

Affiliations

Prominent microglial inclusions in transgenic mouse models of α-synucleinopathy that are distinct from neuronal lesions

Gaye Tanriöver et al. Acta Neuropathol Commun. .

Abstract

Alpha-synucleinopathies are a group of progressive neurodegenerative disorders, characterized by intracellular deposits of aggregated α-synuclein (αS). The clinical heterogeneity of these diseases is thought to be attributed to conformers (or strains) of αS but the contribution of inclusions in various cell types is unclear. The aim of the present work was to study αS conformers among different transgenic (TG) mouse models of α-synucleinopathies. To this end, four different TG mouse models were studied (Prnp-h[A53T]αS; Thy1-h[A53T]αS; Thy1-h[A30P]αS; Thy1-mαS) that overexpress human or murine αS and differed in their age-of-symptom onset and subsequent disease progression. Postmortem analysis of end-stage brains revealed robust neuronal αS pathology as evidenced by accumulation of αS serine 129 (p-αS) phosphorylation in the brainstem of all four TG mouse lines. Overall appearance of the pathology was similar and only modest differences were observed among additionally affected brain regions. To study αS conformers in these mice, we used pentameric formyl thiophene acetic acid (pFTAA), a fluorescent dye with amyloid conformation-dependent spectral properties. Unexpectedly, besides the neuronal αS pathology, we also found abundant pFTAA-positive inclusions in microglia of all four TG mouse lines. These microglial inclusions were also positive for Thioflavin S and showed immunoreactivity with antibodies recognizing the N-terminus of αS, but were largely p-αS-negative. In all four lines, spectral pFTAA analysis revealed conformational differences between microglia and neuronal inclusions but not among the different mouse models. Concomitant with neuronal lesions, microglial inclusions were already present at presymptomatic stages and could also be induced by seeded αS aggregation. Although nature and significance of microglial inclusions for human α-synucleinopathies remain to be clarified, the previously overlooked abundance of microglial inclusions in TG mouse models of α-synucleinopathy bears importance for mechanistic and preclinical-translational studies.

Keywords: Amyloid; Conformation; Inclusion; Microglia; Parkinson’s disease; Prion-like; Synuclein.


Conflict of interest statement

The authors declare no conflict of interest.

Figures
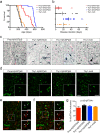
Fig. 1
Fig. 1
Life span, disease duration, and end-stage αS lesions of different αS TG mouse lines. (a) Kaplan-Meier curves for the appearance of clinical end-stage motor signs in Prnp-h[A53T]αS (red curve, median 447 days, n = 15), Thy1-h[A53T]αS (black curve, median 221 days, n = 15), Thy1-h[A30P]αS (blue curve, median 580 days, n = 15), and Thy1-mαS (orange curve, median 242 days, n = 15). When survival times of TG lines were compared to each other pair-wise, statistically significant differences were found (Log-rank test, p < 0.0001) except for Thy1-h[A53T]αS vs. Thy1-mαS. (b) Disease duration starting from onset of motor signs until end-stage phenotype in Prnp-h[A53T]αS (red, median 7 days), Thy1-h[A53T]αS (black, median 18 days), Thy1-h[A30P]αS (blue, median 33 days), and Thy1-mαS (orange, median 21 days). When disease durations of TG lines were compared to each other pair-wise, only Prnp-h[A53T]αS and Thy1-h[30P]αS lines had a statistical difference in their disease duration (One-way ANOVA, Bonferroni’s multiple comparison test, p < 0.0001). (c) Immunostaining of inclusions labeled with the p-αS antibody, which recognizes phosphorylated αS at serine 129, in Prnp-h[A53T]αS, Thy1-h[A53T]αS, Thy1-h[A30P]αS, and Thy1-mαS mice. Nuclear fast red was used as counterstain. Representative sagittal sections of the midbrain from 12-, 7.3-, 20.8-, and 8.3-month-old mice, respectively, are shown. Scale bars, 50 μm and 20 μm (insert). (d) Representative images of pFTAA-positive inclusions in the brainstem of terminally ill Prnp-h[A53T]αS, Thy1-h[A53T]αS, Thy1-h[A30P]αS, and Thy1-mαS mice. Scale bars, 50 μm and 20 μm (insert). (e) Fluorescence double-staining for p-αS (red) and ThioS (green) of brainstem pathology in Thy1-h[A30P]αS. Examples of p-αS-positive inclusion (arrowhead outlines) and ThioS-positive aggregate (white arrowheads) are shown in high magnification (inserts). (f) Fluorescence double-staining for p-αS (red) and pFTAA (green) of brainstem pathology in Thy1-h[A30P]αS. Note that many of the pFTAA-positive inclusions are not co-labeled with the p-αS antibody. Examples of a p-αS/pFTAA-double-positive inclusion (arrowhead outline) and a pFTAA-positive deposit in absence of p-αS signal (white arrowhead) are in high magnification (inserts). (g) Percentage of pFTAA-positive inclusions that are lacking p-αS signal. A similar proportion of non-overlapping pFTAA signal among the lines was found (n = 3 mice per mouse line). Results are expressed as mean ± SEM
Fig. 2
Fig. 2
Distinct pFTAA-positive inclusions in neurons and microglia of symptomatic αS TG mice. (a) Fluorescence double-staining for pFTAA (green) and NeuN (red) of brainstem pathology in Thy1-h[A30P]αS. Examples of neuronal pFTAA-positive inclusions around the nuclei are shown (arrowhead outlines). Scale bars, 50 μm and 20 μm (inserts). (b) Fluorescence double-staining for pFTAA (green) and Iba1 (red) of brainstem pathology in Thy1-h[A30P]αS. Examples of microglial pFTAA-positive inclusions are shown (arrowheads). Scale bars, 50 μm and 20 μm (inserts). (c) The percentage of microglia containing pFTAA-positive inclusions for all mouse lines. The proportion of pFTAA-/Iba1-double-positive cells was not significantly different between the lines (n = 3 mice per line). Results are expressed as mean ± SEM. (d, e) Spectral analysis of pFTAA-positive inclusions in neurons and microglia. (d) Mean emission spectra of NeuN-positive (dotted lines) and Iba1-positive (solid lines) deposits in Prnp-h[A53T]αS (red, n = 8), Thy1-h[A53T]αS (black, n = 8), Thy1-h[A30P]αS (blue, n = 8), and Thy1-mαS (orange, n = 5). Vertical black dotted lines represent the first peak and the shoulder of pFTAA spectra at wavelengths of 513 and 584 nm, respectively. (e) The ratio of emission intensity at wavelengths 513 and 584 nm calculated to show the spectral shift of pFTAA upon binding to neuronal (empty triangles) and microglial (solid triangles) inclusions in Prnp-h[A53T]αS (red, n = 8), Thy1-h[A53T]αS (black, n = 8), Thy1-h[A30P]αS (blue, n = 8), and Thy1-mαS (orange, n = 5). Two-way ANOVA (cell type x mouse line) revealed a significant effect for cell type [F(1,50) = 218, ****P < 0.0001], but not for mouse line [F(3,50) = 2.156, P = 0.1049] or interaction between cell type and mouse line [F(3,50) = 1.842, P = 0.1516]. The results are expressed as mean ± SEM
Fig. 3
Fig. 3
Characterization of microglial αS inclusions in symptomatic αS TG mice. (a) Schematic of αS showing the N-terminal region (light green) with PD-linked mutations A30P (blue) and A53T (red), NAC domain (light orange) and C-terminus (light blue) with four phosphorylation sites (purple). Black lines indicate the epitopes of antibodies specific for the N-terminus (34–45), NAC domain (80–96), C-terminus (177–122), and p-αS (phosphorylated αS at serine 129) that were used for immunofluorescence staining. (b-e) Co-immunofluorescence staining for Iba1 (red) and epitope-specific αS antibodies (green) in the brainstem of terminally ill Thy1-h[A30P]αS. (b) Section of Iba1-positive microglia with 34–45-positive αS aggregates. Note that most Iba1-positive cells are also labeled with anti-αS antibody. Complete overlapping signal of Iba1 and anti-αS 34–45 antibodies in the enlarged images. (c) Section of Iba1-positive microglia with 80–96-positive αS inclusions. Note that most Iba1-positive cells are co-localized with anti-αS antibody. Complete overlapping signal of Iba1 and anti-αS 80–96 antibodies in the enlarged images. (d) Section of Iba1-positive microglia and 117–122 anti-αS antibody. Note that most Iba1-positive cells are devoid of 117–122 anti-αS antibody staining. A rare occasion with partial overlap of Iba1 and 117–122 anti-αS signal is demonstrated in the enlarged images suggesting microglia phagocytosing αS-positive structure. (e) Section of Iba1-positive cells labeled with p-αS antibody. Note that most of the Iba1-positive cells are p-αS-negative. Similar to (d), a rare occasion with partial overlap of Iba1 and anti-p-αS signal is demonstrated in the enlarged images suggesting microglia phagocytosing αS-positive structure. Scale bars, 50 μm and 20 μm (enlarged images)
Fig. 4
Fig. 4
pFTAA-positive microglia in presymptomatic αS TG mice and seeded αS induction model. (a, b) Representative brainstem sections of a 15-month-old presymptomatic Thy1-h[A30P]αS mouse, presumed 4–6 weeks before the first symptoms occur. (a) Immunostaining of p-αS-positive aggregates (black). Perikaryal (arrowhead outlines) and neuritic (arrows) inclusions are highlighted. Section was counterstained using nuclear fast red. Scale bars, 50 μm and 20 μm (insert). (b) Fluorescence double staining of Iba1-positive microglia (red) and pFTAA-positive inclusions (green), showing neuritic pFTAA-positive inclusions (arrows) and pFTAA-positive aggregates in Iba1-positive cells (arrowheads). Example of a pFTAA-positive microglia is shown in high magnification (inserts). Scale bars, 50 μm and 20 μm (inserts). (c) Schematic illustration of the intracerebral injection paradigm (left) and sagittal sections of dentate gyrus (DG, site of injection) stained with p-αS antibody (blue) from Thy1-h[A30P]αS mice that have been injected 30 days prior with either brainstem extract from end-stage TG mice (TG extract) or brain extract from WT mice (WT extract). In TG extract-injected mice, abundant p-αS-positive aggregates were detected. In contrast, WT extract did not induce any inclusion. Sections were counterstained using nuclear fast red. Scale bar, 100 μm. (d, e) Representative sagittal sections from either WT extract- (d) or TG extract-injected (e) Thy1-h[A30P]αS mice stained with pFTAA (green) and Iba1 (red). (d) No pFTAA-positive inclusions can be found in microglia of WT extract-injected mice. Scale bars, 50 μm and 20 μm (enlarged images). (e) In contrast, pFTAA-positive inclusions are found in Iba1-positive microglia in DG from Thy1-h[A30P]αS mice. Examples of neuritic pFTAA-positive inclusions (arrows) and pFTAA-positive deposits in microglia (arrowheads) are highlighted. Scale bars, 50 μm and 20 μm (enlarged images)

Similar articles

Cited by

References

    1. Goedert M, Jakes R, Spillantini MG (2017) The Synucleinopathies: twenty years on. J Park Dis 7:S53–S71. 10.3233/JPD-179005 - PMC - PubMed
    1. Sorrentino ZA, Giasson BI, Chakrabarty P (2019) α-Synuclein and astrocytes: tracing the pathways from homeostasis to neurodegeneration in Lewy body disease. Acta Neuropathol 138:1–21. 10.1007/s00401-019-01977-2 - PMC - PubMed
    1. Peelaerts W, Bousset L, Van Der Perren A, et al (2015) α-Synuclein strains cause distinct synucleinopathies after local and systemic administration. Nature 522:340–344. 10.1038/nature14547 - PubMed
    1. Prusiner SB, Woerman AL, Mordes DA, et al (2015) Evidence for α-synuclein prions causing multiple system atrophy in humans with parkinsonism. Proc Natl Acad Sci U S A 112:E5308–E5317. 10.1073/pnas.1514475112 - PMC - PubMed
    1. Tarutani A, Arai T, Murayama S, et al (2018) Potent prion-like behaviors of pathogenic α-synuclein and evaluation of inactivation methods. Acta Neuropathol Commun 6:29. 10.1186/s40478-018-0532-2 - PMC - PubMed

Publication types

Substances