Mechanism of Action of Ketogenic Diet Treatment: Impact of Decanoic Acid and Beta-Hydroxybutyrate on Sirtuins and Energy Metabolism in Hippocampal Murine Neurons
- PMID: 32784510
- PMCID: PMC7468807
- DOI: 10.3390/nu12082379
Mechanism of Action of Ketogenic Diet Treatment: Impact of Decanoic Acid and Beta-Hydroxybutyrate on Sirtuins and Energy Metabolism in Hippocampal Murine Neurons
Abstract
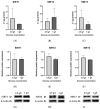
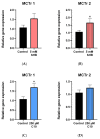
The ketogenic diet (KD), a high-lipid and low-carbohydrate diet, has been used in the treatment of epilepsy, neurodegenerative disorders, inborn errors of metabolism and cancer; however, the exact mechanism/s of its therapeutic effect is not completely known. We hypothesized that sirtuins (SIRT)-a group of seven NAD-dependent enzymes and important regulators of energy metabolism may be altered under KD treatment. HT22 hippocampal murine neurons were incubated with two important KD metabolites-beta-hydroxybutyrate (BHB) (the predominant ketone body) and decanoic acid (C10), both accumulating under KD. Enzyme activity, protein, and gene expressions of SIRT 1-4, enzyme capacities of the mitochondrial respiratory chain complexes (MRC), citrate synthase (CS) and gene expression of monocarboxylate transporters were measured in control (untreated) and KD-treated cells. Incubation with both-BHB and C10 resulted in significant elevation of SIRT1 enzyme activity and an overall upregulation of the MRC. C10 incubation showed prominent increases in maximal activities of complexes I + III and complex IV of the MRC and ratios of their activities to that of CS, pointing towards a more efficient functioning of the mitochondria in C10-treated cells.
Keywords: beta-hydroxybutyrate; decanoic acid; energy metabolism; ketogenic diet; mitochondria; sirtuins.
Conflict of interest statement
The authors declare no conflict of interest. The funders had no role in the design of the study; in the collection, analyses, or interpretation of data; in the writing of the manuscript, or in the decision to publish the results.
Figures


Similar articles
-
Ketogenic Diet: Impact on Cellular Lipids in Hippocampal Murine Neurons.Nutrients. 2020 Dec 18;12(12):3870. doi: 10.3390/nu12123870. Nutrients. 2020. PMID: 33352829 Free PMC article.
-
Simplification of Dietary Treatment in Pharmacoresistant Epilepsy: Impact of C8 and C10 Fatty Acids on Sirtuins of Neuronal Cells In Vitro.Nutrients. 2024 May 29;16(11):1678. doi: 10.3390/nu16111678. Nutrients. 2024. PMID: 38892612 Free PMC article.
-
The ketogenic diet component decanoic acid increases mitochondrial citrate synthase and complex I activity in neuronal cells.J Neurochem. 2014 May;129(3):426-33. doi: 10.1111/jnc.12646. Epub 2014 Jan 25. J Neurochem. 2014. PMID: 24383952
-
Energy metabolism as part of the anticonvulsant mechanism of the ketogenic diet.Epilepsia. 2008 Nov;49 Suppl 8(Suppl 8):91-3. doi: 10.1111/j.1528-1167.2008.01846.x. Epilepsia. 2008. PMID: 19049599 Free PMC article. Review.
-
Modulation of Cellular Biochemistry, Epigenetics and Metabolomics by Ketone Bodies. Implications of the Ketogenic Diet in the Physiology of the Organism and Pathological States.Nutrients. 2020 Mar 17;12(3):788. doi: 10.3390/nu12030788. Nutrients. 2020. PMID: 32192146 Free PMC article. Review.
Cited by
-
Ketogenic Diet: Impact on Cellular Lipids in Hippocampal Murine Neurons.Nutrients. 2020 Dec 18;12(12):3870. doi: 10.3390/nu12123870. Nutrients. 2020. PMID: 33352829 Free PMC article.
-
Multi-omics revealed rumen microbiota metabolism and host immune regulation in Tibetan sheep of different ages.Front Microbiol. 2024 Feb 13;15:1339889. doi: 10.3389/fmicb.2024.1339889. eCollection 2024. Front Microbiol. 2024. PMID: 38414776 Free PMC article.
-
Nutraceutical activation of Sirt1: a review.Open Heart. 2022 Dec;9(2):e002171. doi: 10.1136/openhrt-2022-002171. Open Heart. 2022. PMID: 36522127 Free PMC article. Review.
-
Targetable Pathways for Alleviating Mitochondrial Dysfunction in Neurodegeneration of Metabolic and Non-Metabolic Diseases.Int J Mol Sci. 2021 Oct 23;22(21):11444. doi: 10.3390/ijms222111444. Int J Mol Sci. 2021. PMID: 34768878 Free PMC article. Review.
-
Ketogenic Diet Increases Serum and White Adipose Tissue SIRT1 Expression in Mice.Int J Mol Sci. 2022 Dec 13;23(24):15860. doi: 10.3390/ijms232415860. Int J Mol Sci. 2022. PMID: 36555502 Free PMC article.
References
MeSH terms
Substances
Grants and funding
LinkOut - more resources
Full Text Sources

